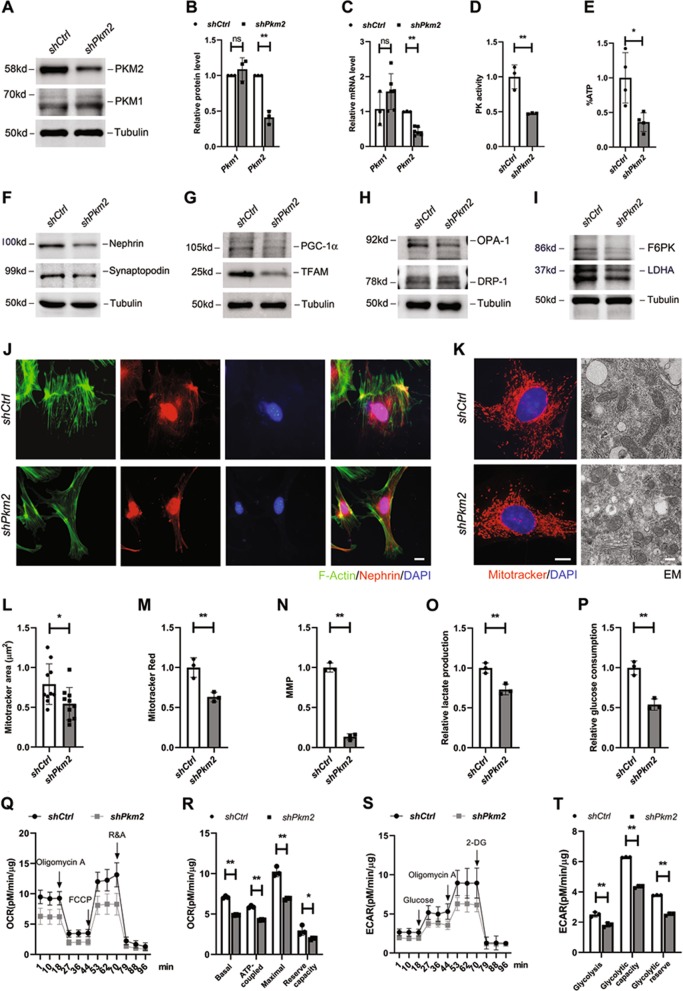
Fig. 6. The effect of Pkm2 depletion on differentiation, mitochondria OXPHOS and glycolysis.
a Representative western blotting results of PKM2 and PKM1 in control (shCtrl) and Pkm2-knockdown (shPkm2) podocytes (n = 3). b Bar charts show means of optical density (O.D.), and normalized to cells transfected with shCtr-RNAi lentivirus. c Real-time PCR analysis of Pkm2 and Pkm1 mRNA levels in the absence or presence of Pkm2-RNAi lentivirus (n = 3–6). d PK activity in different podocytes as indicated (n = 3). e ATP level was normalized by protein content, and used shCtrl podocyte as control. f Representative western blotting results of nephrin and synaptopodin expression level in cultured podocytes as indicates (n = 3). g Representative western blotting results of PGC-1α and TFAM expression level (n = 3). h Representative blot images of OPA-1 and DRP-1 (n = 3). i Representative blot images of F6PK and LDHA (n = 3). j Immunofluorescence staining for nephrin (red), phalloidine for F-actin (green) and DAPI for nuclear (blue). Scale bar=5 μm. k Representative immunofluorescence and electron microscopy (EM) images showing alterations in mitochondrial morphologies between different podocytes as indicated. In the immunofluorescence images, cells are labeled with MitoTracker Red (red) for mitochondria and DAPI (blue) for nuclear. Left scale bar = 2 µm. Right scale bar = 500 nm. Pictures show representative fields of over 10 cells photographed. l–n Average mitochondrial area, mitochondrial mass and MMP. o, p Relative lactate production and glucose consumption in culture medium derived from podocytes, and shCtrl podocyte was used as control (n = 3). q Effects of PKM2 on OCR in podocytes (n = 4). OCR traces were obtained using a Seahorse XF96 Analyzer. r Statistical analyses of baseline respiratory capacity, ATP-coupled respiratory capacity, maximum respiratory capacity and reserve respiratory capacity in OCR. s Effects of PKM2 on ECAR in podocytes (n = 4). t Statistical analyses of glycolysis, glycolytic capacity and glycolytic reserve in ECAR.

