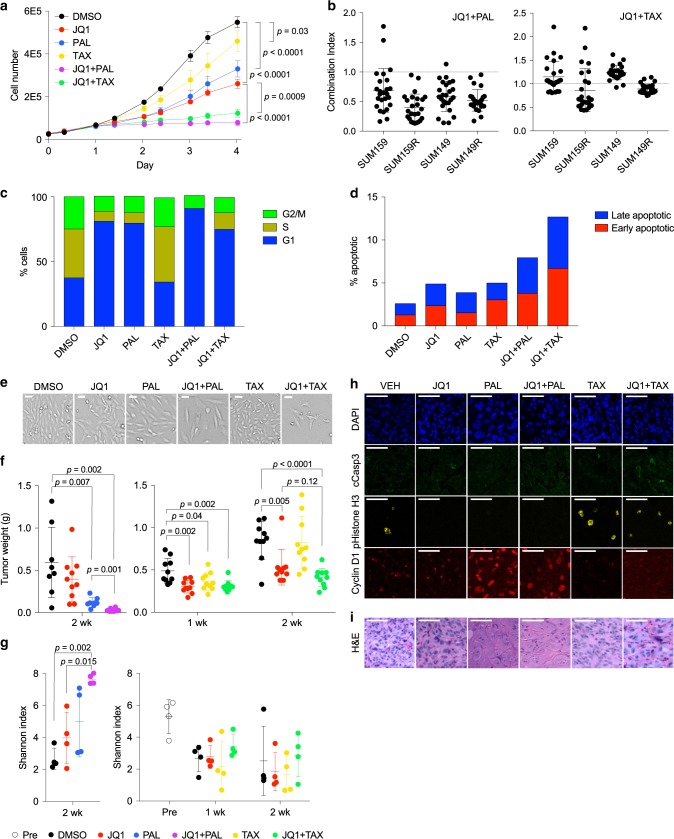
Fig. 1. Palbociclib and paclitaxel synergize with JQ1 to induce cell-cycle arrest.
a Growth curves of SUM159 cells treated in vitro with JQ1, palbociclib (PAL), and paclitaxel (TAX), alone and in combinations. Data are represented as mean ± SD, n = 3, one-way ANOVA followed by Sidak’s multiple comparisons test. Source data are provided as a Source Data file. b Levels of synergism between JQ1 and palbociclib (left) and paclitaxel (right) at various doses in parental lines (SUM159 and SUM149) and derived JQ1-resistant lines (SUM159R and SUM149R). Each point represents the combination index (CI) for one pair of concentrations, averaged over eight replicates. Mean ± SD are shown, CI = 1 additive, CI < 1 synergistic, and CI > 1 antagonistic. Source data are provided as a Source Data file. c Proportion of SUM159 cells in each cell-cycle phase following 24 h of treatment, determined by the Watson cell cycle model using flow cytometry on PI-stained SUM159 cells. n = 2. d Proportion of early apoptotic (annexin V+/PI−) and late apoptotic (annexin V+/PI+) SUM159 cells using flow cytometry following 3 days of treatment. n = 1. e Brightfield images of treated SUM159 cells. Images are representative of three independent experiments performed in triplicates. Scale bars represent 100 µm. f Tumor weights of SUM159 xenografts following 1 or 2 weeks of treatment. Mean ± SD are shown, n = 10, two-tailed Student’s t-test. Source data are provided as a Source Data file. g Shannon indices of barcode diversity of SUM159 xenografts before treatment and following 1 or 2 weeks of treatment. Mean ± SD are shown, n = 4, one-way ANOVA followed by Sidak’s multiple comparisons test. h Immunofluorescence staining for cleaved caspase 3, pHistone H3, and cyclin D1 in xenografts following 2 weeks of treatment. Images are representative of one experiment performed with five mice per group each with bilateral tumors. Scale bars represent 50 µm. i Hematoxylin and eosin staining of SUM159 xenografts. Scale bars represent 50 µm.

