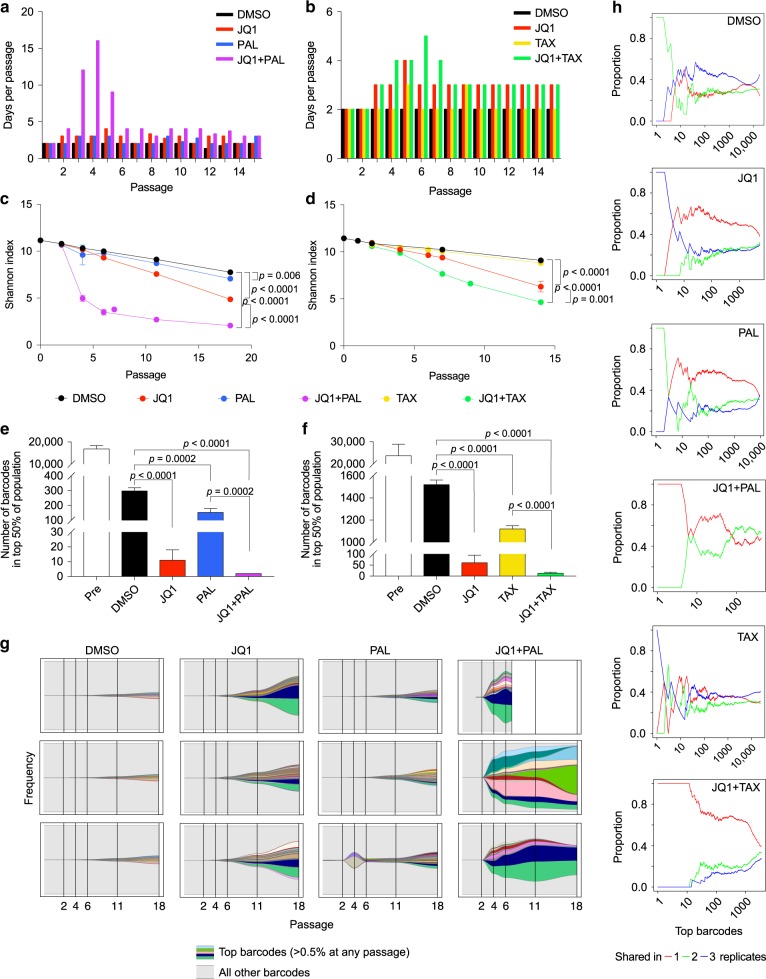
Fig. 2. Long-term treatment with JQ1 combinations selects for both clones with pre-existing and acquired resistance.
a Number of days between passages of barcoded SUM159 cells in DMSO, JQ1, palbociclib (PAL), and JQ1 + palbociclib. n = 3, except JQ1 + palbociclib in which n = 2 after passage 7. b Number of days between passages of barcoded SUM159 cells in DMSO, JQ1, paclitaxel (TAX), and JQ1 + paclitaxel. n = 3. c Shannon indices of diversity of barcodes in SUM159 cells passaged in JQ1 and palbociclib alone and in combination. Data are represented as mean ± SD, n = 3 except JQ1 + palbociclib in which n = 2 after passage 7, one-way ANOVA followed by Sidak’s multiple comparisons test. d Shannon indices of diversity of barcodes in SUM159 cells passaged in JQ1 and paclitaxel alone and in combination. Data are represented as mean ± SD, n = 3, one-way ANOVA followed by Sidak’s multiple comparisons test. e Number of barcodes making up the top 50% of the cell population before treatment and at the last passage of JQ1 and palbociclib. Data are represented as mean ± SD, n = 3 except JQ1 + palbociclib in which n = 2, one-way ANOVA followed by Sidak’s multiple comparisons test. f Number of barcodes making up the top 50% of the cell population before treatment and at the last passage of JQ1 and paclitaxel. Data are represented as mean ± SD, n = 3, one-way ANOVA followed by Sidak’s multiple comparisons test. g Frequencies of top barcodes (those representing at least 0.5% of the population at any passage) in cell populations selected with JQ1 and palbociclib, alone and in combination. Colors represent unique barcodes, gray background represents all other barcodes in the population, and each plot represents one replicate. Frequencies of all barcodes (y-axis) add up to 100%. h Representative plots of proportions of top barcodes ranked by frequency (x-axis) in one replicate at the last passage that are unique to that replicate, shared between two replicates, or shared between all three replicates in each treatment group.

