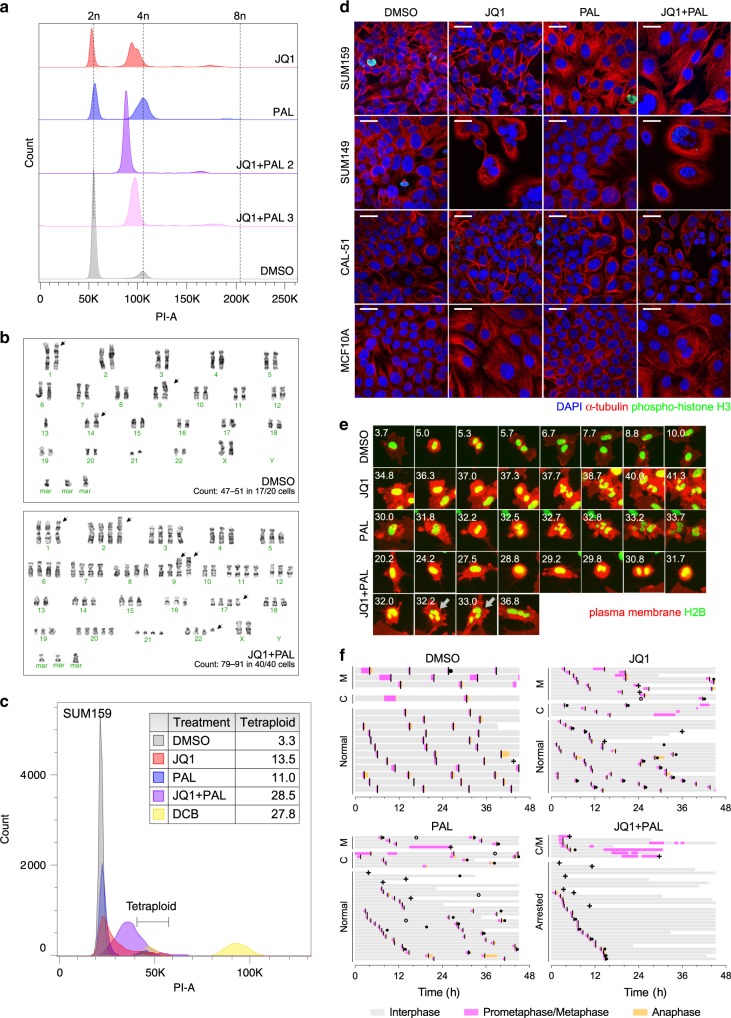
Fig. 5. JQ1 and palbociclib induce increased ploidy through cell division failure.
a Histograms of DNA content by flow cytometry in PI-stained post-selection SUM159 cells. b Representative karyotypes of post-selection SUM159 cells after passaging in DMSO (top) and in JQ1 + palbociclib (bottom). Ranges of chromosome numbers and numbers of metaphase spreads counted are shown. Arrows indicate chromosomal abnormalities. c Histogram of DNA content by flow cytometry in Hoechst-stained FUCCI-labeled G1 SUM159 cells following 7 days of treatment. Dihydrocytochalasin B (DCB)-induced tetraploid cells were used as a positive control. Table indicates proportions of cells in the tetraploid gate. d Immunofluorescence staining of α-tubulin and phospho-histone H3 with DAPI in SUM159, SUM149, CAL-51, and MCF10A cells following 7 days of treatment. Images are representative of three independent experiments. Scale bars represent 25 µm. e Time-lapse live cell imaging of SUM159 cells with fluorescently labeled H2B and plasma membrane undergoing mitosis during treatment with DMSO, JQ1, palbociclib, and JQ1 + palbociclib. Numbers indicate hours following start of treatment. Arrows indicate failed cytokinesis. Images are representative of three independent experiments. f Cell cycle phase lengths for individual cells during time-lapse imaging period. Each bar represents one single cell. Line indicates onset of cytokinesis. Chromosomal missegregation (closed circle), apoptosis (plus sign), and fusion (open circle) events are marked. Time indicates hours following start of treatment. M mitotic delay (prometaphase/metaphase > 1 h), C cytokinesis failure, A arrested.

