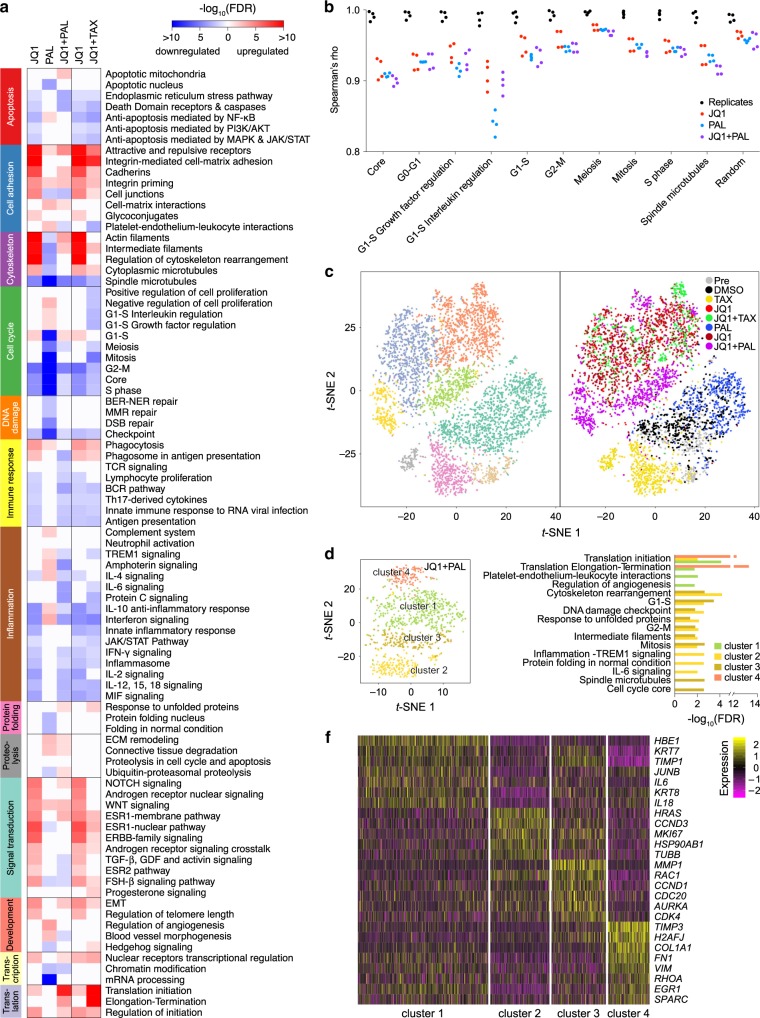
Fig. 6. G1-S pathways are upregulated in JQ1 + palbociclib-resistant cells.
a Enriched process networks in differentially expressed genes by bulk RNA-seq of post-JQ1, palbociclib, JQ1 + palbociclib, and JQ1 + paclitaxel-selected cells compared with post-DMSO-selected cells. b Spearman’s rank correlation coefficient (rho) for bulk expression of genes in cell cycle related process networks. Black indicates comparison between replicates in post-DMSO, JQ1, palbociclib, and JQ1 + palbociclib-selected groups. Red, blue, and purple indicate all pairwise comparisons between post JQ1, palbociclib, and JQ1 + palbociclib-selected cells with post-DMSO-selected cells. c t-SNE plots of cells from the pre-selection and each post-selection population by single-cell RNA-seq, colored by cluster (left) and by treatment (right). Each point represents one single cell. d t-SNE plot of cells from only the JQ1 + palbociclib-selected population by single-cell RNA-seq colored by cluster. Each point represents one single cell. e Enriched process networks in differentially expressed genes in each cluster of the JQ1 + palbociclib-selected population by single-cell RNA-seq. f Heatmap of differentially expressed genes in each cluster in the JQ1 + palbociclib-selected population by single-cell RNA-seq. Each column represents one single cell.

