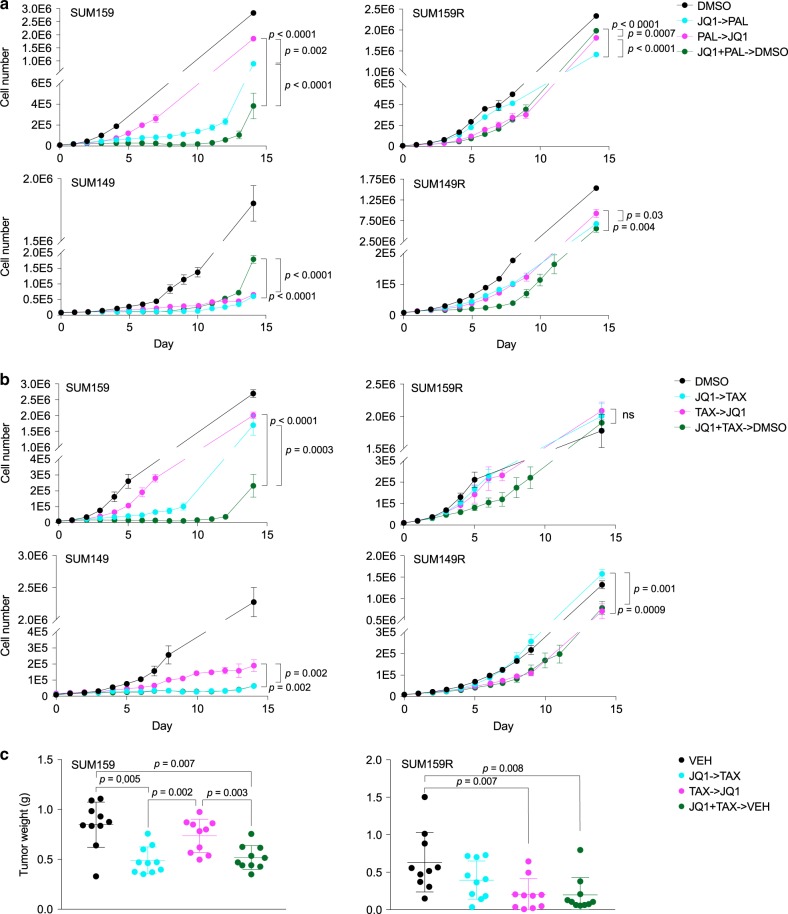
Fig. 7. Drug schedule affects treatment outcome and varies between cell lines.
a Growth curves of parental (SUM159 and SUM149) and derived JQ1-resistant (SUM159R and SUM149R) cell lines treated with JQ1 and palbociclib sequentially in either order or concomitantly followed by vehicle. Data are represented as mean ± SD, n = 3, one-way ANOVA followed by Tukey’s multiple comparisons test. b Growth curves of parental (SUM159 and SUM149) and derived JQ1-resistant (SUM159R and SUM149R) cell lines treated with JQ1 and paclitaxel sequentially in either order or concomitantly followed by vehicle. Data are represented as mean ± SD, n = 3, one-way ANOVA followed by Tukey’s multiple comparisons test. ns not significant. c Tumor weights of SUM159 and SUM159R xenografts following 2 weeks of treatment with JQ1 and paclitaxel sequentially in either order or concomitantly followed by vehicle. Mean ± SD are shown, n = 10, two-tailed Student’s t-test. Source data are provided as a Source Data file.

