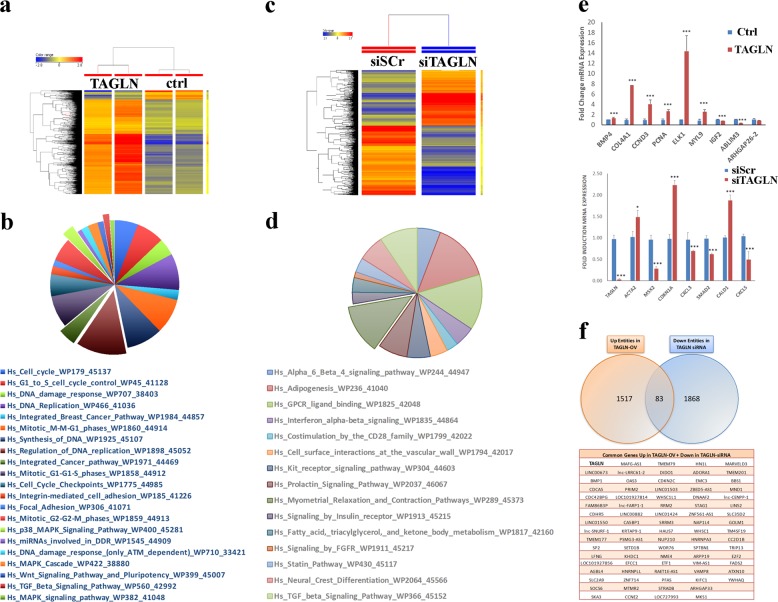
Fig. 5. TAGLN regulates several functional categories and signaling pathways in CRC.
a Hierarchical clustering of TAGLN-overexpressing or control HCT116 cells based on differentially expressed mRNA levels. Each row represents one replica sample and each column represents an mRNA. Expression level of each gene in a single sample is depicted according to the color scale. b Pie chart illustrating the distribution of the top pathway designations for the upregulated genes in TAGLN-overexpressing HCT116 cells. c Hierarchical clustering of TAGLN-depleted (siTAGLN) and control (siScr) RKO cells based on differentially expressed mRNA levels. d Pie chart illustrating the distribution of the top pathway designations for the downregulated genes in siTAGLN transfected RKO cells. e qRT-PCR validation of selected genes from microarray, n = 2, *P < 0.05, **P < 0.005, ***P < 0.005. f Venn-diagram depicting the overlap between the upregulated genes in TAGLN-overexpressing HCT116 and the downregulated genes in TAGLN-depleted RKO cells.

