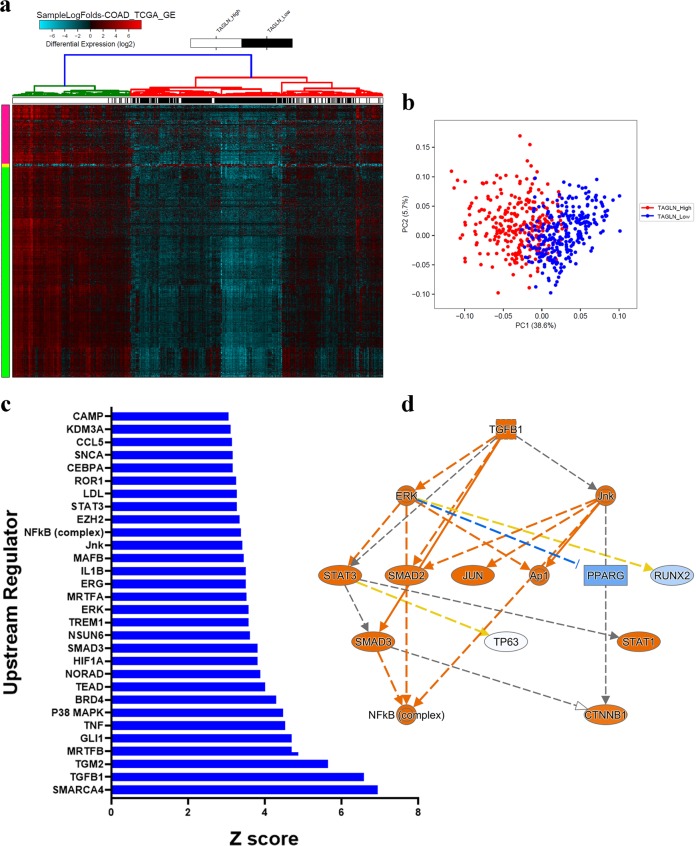
Fig. 7. Molecular signature of TAGLNhigh COAD.
a Heat map clustering of TAGLNhigh (m = 296) and TAGLNlow (n = 296) COAD. Samples were stratified into TAGLNhigh and TAGLNlow based on median TAGLN expression. Each row represents expression level of an mRNA (log2). mRNA expression level in a single sample is depicted according to the color scale. b Principal component analysis (PCA) for TAGLNhigh (m = 296) and TAGLNlow COAD. c Bar-graph depicting the top thirty significantly activated upstream regulator networks in TAGLNhigh vs TAGLNlow COAD. Activation Z-score is indicated on the x-axis. d Illustration of the TGFβ1 mechanistic network.

