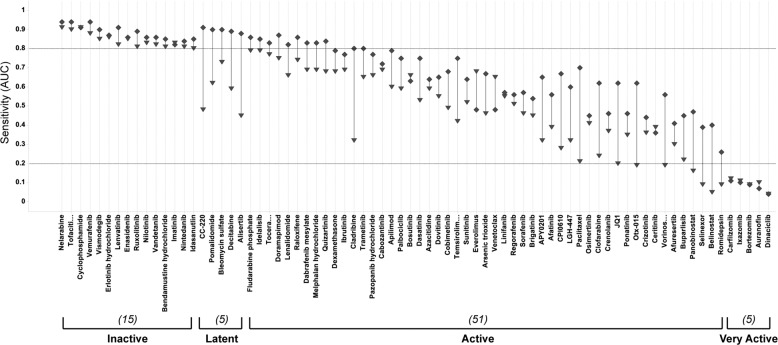
Fig. 1. Validation of the 24 h time point in HMCLs.
Plot of the sensitivity per drug at 24 h and 72 h drug incubation time points. Sensitivity is captured by the median AUC per drug, per time point (diamond for 24 h, triangle for 72 h). Drugs are rank-ordered by increasing sensitivity from left to right, and activity classes annotated under the plot. Counts of the number of drugs per class are indicated in parentheses. Except for the latent class, early detection of drug response at 24 h is found for 71/76 drugs in the panel (93%).

