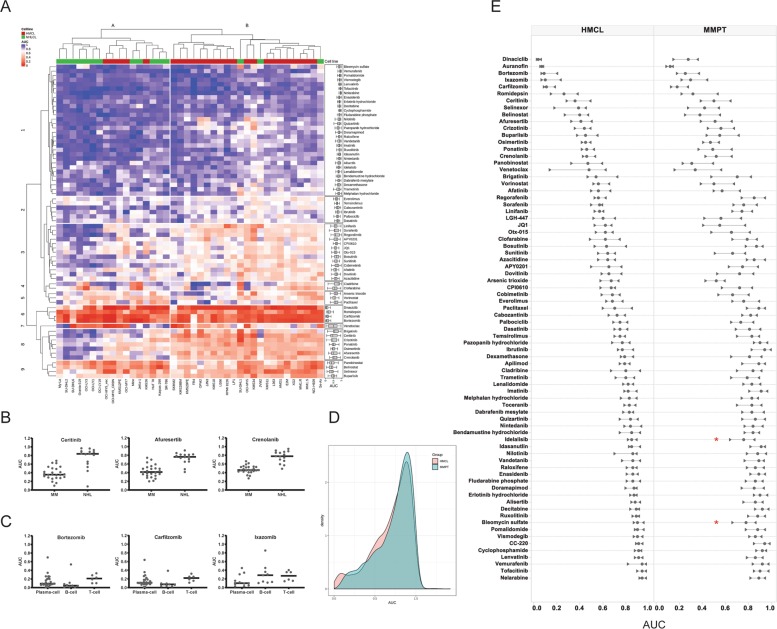
Fig. 3. Drug sensitivity profiling in HMCLs and NHLCLs highlights MM specificity of the MMDP and high similarity of drug sensitivity landscapes in HMCLs and in MM primary samples.
a Hierarchical clustering analysis of drug sensitivities (AUCs) identifies two dominant cell line clusters (column clusters A and B) defining seven major drug subgroups (row clusters 1–7). Individual drug sensitivity distributions are inserted as box plots on the right side of the heatmap. The heatmap shows that for most drug classes except the broadly cytotoxic ones (row clusters 6 and 9), the MMDP drugs are overall more sensitive in MM than in NHL. b Scatter plot of the drug sensitivity (AUC) by cell line subgroup; horizontal bars represent the median AUC. The ALK inhibitor ceritinib, the AKT inhibitor afuresertib, and the PDGFR/FLT3 inhibitor crenolanib are highly sensitive in HMCLs while they are poorly sensitive in NHLCLs. The dataset of all drugs with significant differential sensitivity in HMCLs versus NHLCLs is provided in Supplemental Table 6. c Scatter plot of the drug sensitivity (AUC) by cell type; horizontal bars represent the median AUC. The PIs bortezomib and carfilzomib were more sensitive in plasma cell (HMCLs) than in T-cell NHLCLs but less than in B-cell NHLCLs; Ixazomib was more specific to MM overall. d AUC density plots using Gaussian kernel for HMCLs (red) and 99 primary samples in our cohort with MM diagnosis (MMPT, cyan). AUCs fall in the 0~1.0 interval for the most, and distributions are consistent with each other for both sample types, which may imply that the drugs perform similarly on myeloma primary patient samples as they do on the cell lines. e Comparative plot of the interquartile range per drug in HMCLs (left) and MMPTs (right); circles represent the median AUC for each drug, while right and left triangles indicate the value of their first and third quartiles, respectively. Drugs are rank-ordered from top to bottom by increasing median AUC value in HMCLs, i.e., by decreasing sensitivity. The ex vivo sensitivity by drug follows the trends observed in vitro, with interquartile ranges slightly broader in primary samples. While this can partly originate from a higher intrinsic ex vivo assay noise and higher heterogeneity of primary samples as compared to cell lines, this can also importantly pinpoint shifts in differential responses associated with cytogenetic aberrations and occurrence of mutations. Two such cases are highlighted on the plot with red stars for idelalisib and bleomycin, for which our statistical analysis demonstrated that sensitivity of primary patients to these drugs is higher in presence of IDH mutations.

