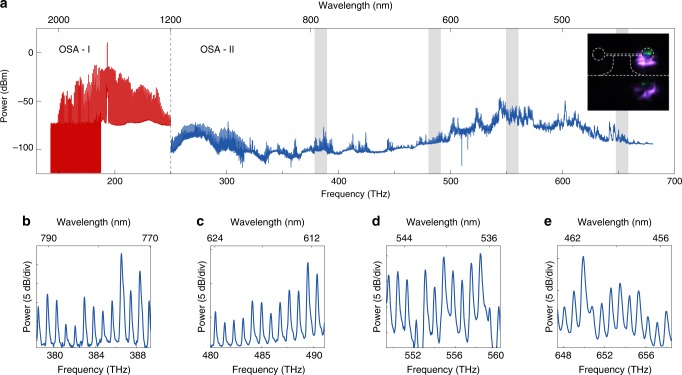
Fig. 2. Optical spectrum of two-octave-spanning microcombs.
a Complete optical spectrum of microcombs. Spectrum measured with Yokogawa optical spectrum analyzer (OSA) above 1200 nm is presented in red, while the shorter wavelength part is measured by an Andor spectrograph (shown in blue). The absolute power of the spectrum are calibrated at 1550 and 635 nm for the OSA and spectrograph, respectively. The power mismatch of the red and blue spectrum at 1200 nm is caused by the spectrograph efficiency variation over the broad spectral range. Inset: an image taken by a CCD camera on the side of the cavity. Green and violet emissions are apparent. b–e Zoom-in spectra of the gray areas are shown in panel a. The frequency ranges for b–e are 378.3–389.4, 480–491.1, 549.3–560.4, and 647.4–658.5 THz.

