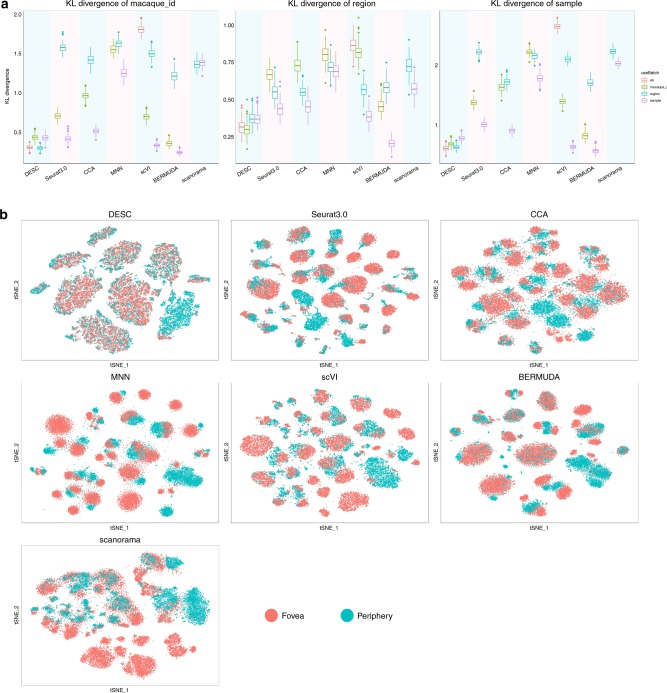
Fig. 2. Comparison of the robustness of different methods for batch definition based on the macaque retina scRNA-seq data.
a The KL divergences calculated for macaque id (left plot), region id (middle plot), and sample id (right plot) when taking macaque id, region id, or sample id as the batch definition in analysis for each method. The box represents the interquartile range, the horizontal line in the box is the median, and the whiskers represent the 1.5 times interquartile range. The word “All” in legend for DESC and scVI indicates that they take the whole dataset as input without considering any batch information in analysis. This figure shows that DESC yields robust results for batch effect removal no matter what batch information was provided in analysis. However, other methods are sensitive to the choice of batch definition. b The t-SNE plots showing region distribution for different methods when region was treated as batch in analysis.

