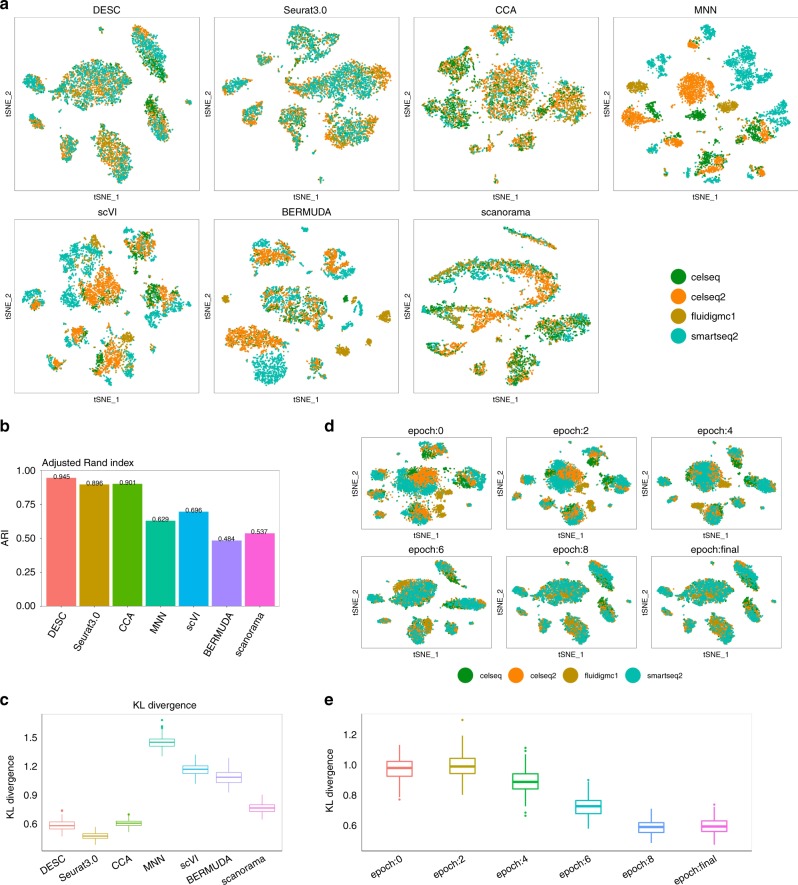
Fig. 4. Clustering results for the pancreatic islet data generated from different scRNA-seq protocols.
a The t-SNE plots in which cells were colored by batch. b The ARI values of different methods. c The KL divergence of different methods. d T-SNE plots showing DESC removes batch effect gradually over iterations. e The KL divergence over iteration. The box in c and e represents the interquartile range, the horizontal line in the box is the median, and the whiskers represent the 1.5 times interquartile range.

