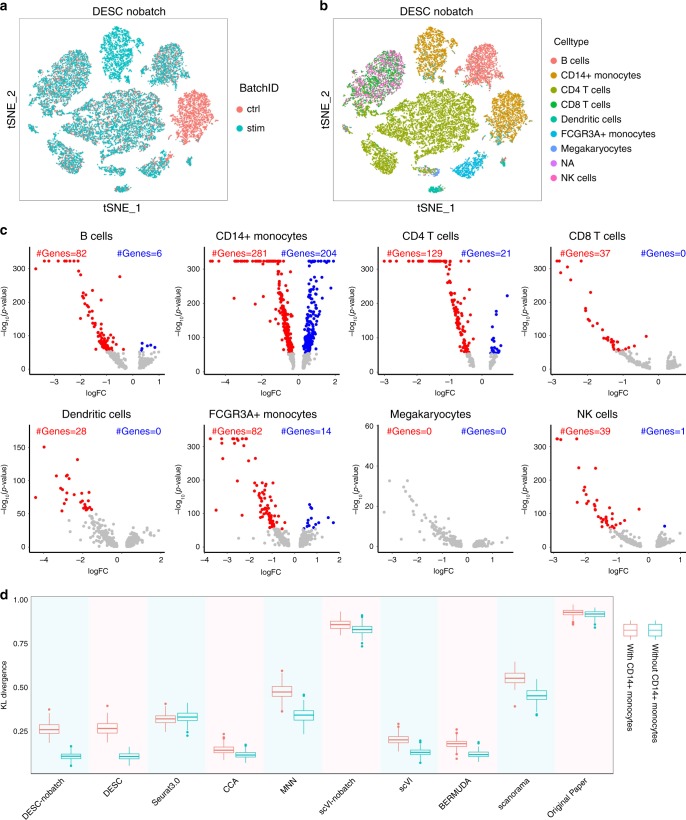
Fig. 5. The results of PBMC data generated by Kang et al.18.
a, b DESC clustering without taking batch information in the analysis. a is colored by Batch ID and b is colored by cell type. c Volcano plots of differential expression analysis between control and stimulated conditions for each cell type. Highlighted are differential expression genes using Wilcoxon rank sum test with fold change > e0.25 and FDR adjusted p value < 10−50. CD14+ monocytes have the most number of differentially expressed genes compared with other cell types. d The KL divergence calculated using all cells and using non-CD14+ monocytes only. The box represents the interquartile range, the horizontal line in the box is the median, and the whiskers represent the 1.5 times interquartile range.

