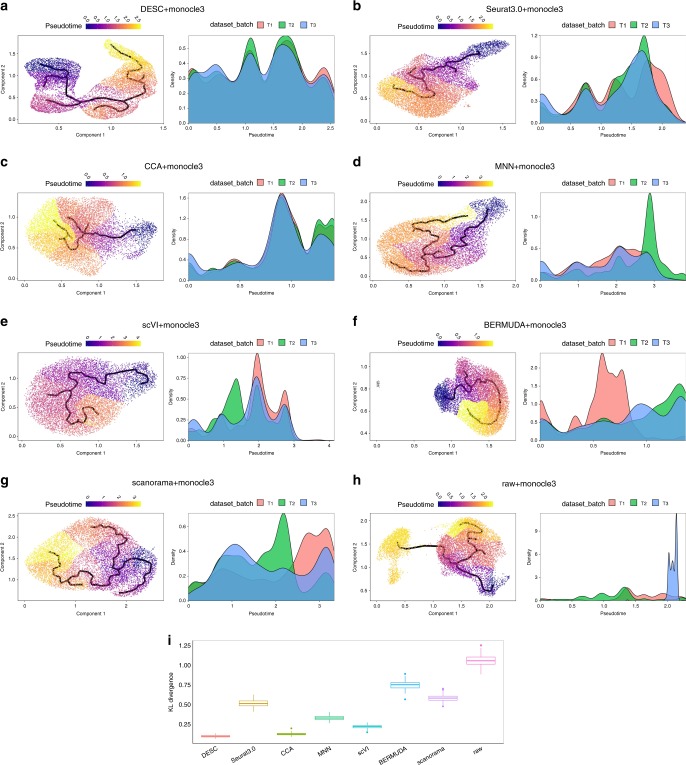
Fig. 7. The estimated pseudotime plots for the human monocyte data.
Shown are the results of Monocle3 estimated pseudotime using a low-dimensional representation from DESC as input; b CCA components from Seurat 3.0 as input; c CCA components from method CCA as input; d PCA components of corrected gene expression values from MNN as input; e low-dimensional representation from scVI as input; f low-dimensional representation from BERMUDA as input; g low-dimensional representation from scanorama as input; h raw gene count matrix as input. Default parameters in Monocle3 were used to conduct dimension reduction and pseudotime estimation. i KL divergences that measure of the degree of batch effect removal for different methods. “Raw” represents the output of Monocle3 using the raw gene count matrix as the input. The box represents the interquartile range, the horizontal line in the box is the median, and the whiskers represent the 1.5 times interquartile range.

