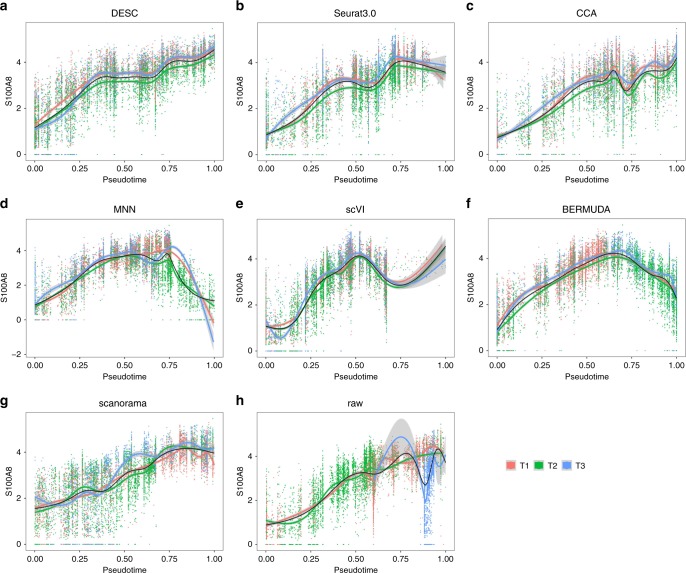
Fig. 8. The expression of marker gene S100A8 (classical monocytes) over pseudotime for different methods for cells across batches.
The black line is the smoothed expression curve when cells from all batches are included. The red, green, and blue lines are the smoothed expression curves for cells from T1, T2, and T3, respectively. Pseudotime from all methods was scaled to [0, 1] for comparison. a Low-dimensional representation from DESC as input; b CCA components from Seurat 3.0 as input; c CCA components from method CCA as input; d PCA components of corrected gene expression values from MNN as input; e low-dimensional representation from scVI as input; f low-dimensional representation from BERMUDA as input; g low-dimensional representation from scanorama as input; h raw gene count matrix as input.

