FIGURE 2.

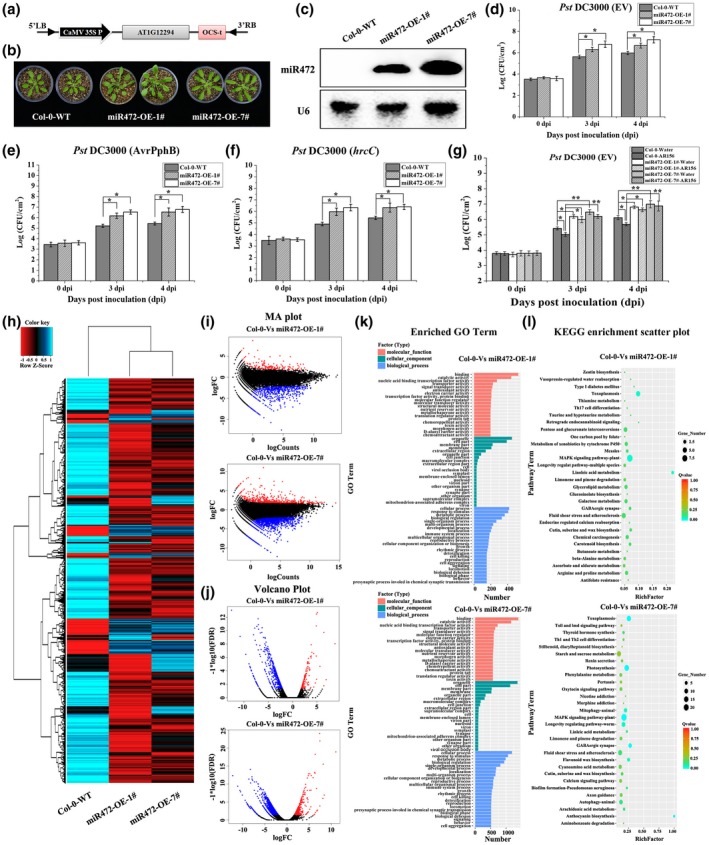
The miR472 overexpression plants are more susceptible to virulent Pseudomonas syringae pv. tomato (Pst) DC3000. The pathogen assay and induced systemic resistance (ISR) triggered by Bacillus cereus AR156 in Arabidopsis thaliana ecotype Col‐0 wild‐type (WT) and miR472 overexpression lines (miR472‐OE‐1# and miR472‐OE‐7#) were done as described in the materials and methods section. (a) Schematic diagram of miR472 overexpression constructs used to generate the transgenic plants. (b) Phenotype of miR472 overexpression transgenic plant (line 7#) was compared to ecotype Col‐0 WT, and the images show the 4‐week‐old seedlings. (c). Expression of miR472 in the overexpression lines (miR472‐OE‐1# and miR472‐OE‐7#) by northern blotting with an miR472 probe; U6 was used as a loading control. (d)–(f) Bacterial growth in 5‐week‐old plants from Col‐0 WT, miR472‐OE‐1#, and miR472‐OE‐7# infiltrated with Pst DC3000 (empty vector, EV) (OD600 = 0.0001), Pst DC3000 (AvrPphB) (OD600 = 0.0005), and Pst DC3000 (hrcC) (OD600 = 0.0001), respectively. (g) Bacterial growth assay of Pst DC3000 (EV) in Col‐0 WT, miR472‐OE‐1#, and miR472‐OE‐7# pretreated with AR156 or 0.85% NaCl. For (d)–(g), the data are means and SD (n = 24). The LSD test was performed to determine the significant differences between miR472 OE lines (miR472‐OE‐1# and miR472‐OE‐7#) and Col‐0 WT. * and ** indicate statistically significant differences at p < .05 and p < .01, respectively. In this part, the experiments were done in three independent biological replicates and similar results were obtained. (h) Cluster analysis of differentially expressed genes (DEGs) in miR472 OE lines (miR472‐OE‐1# and miR472‐OE‐7#) and Col‐0 WT on the expression profiles measured by RNA‐Seq. (i) Manhattan (MA) plot of the DEGs between miR472 OE lines (miR472‐OE‐1# and miR472‐OE‐7#) and Col‐0 WT. (j) Volcano plot of the DEGs between miR472 OE lines (miR472‐OE‐1# and miR472‐OE‐7#) and Col‐0 WT. (k) GO classifications of DEGs across one comparison between miR472 OE lines (miR472‐OE‐1# and miR472‐OE‐7#) and Col‐0 WT. The x axis represents the number of DEGs in a category. The results of miR472 OE lines (miR472‐OE‐1# and miR472‐OE‐7#) versus Col‐0 WT are summarized in three main categories: molecular function (red), cellular component (green), and biological process (blue). (l) KEGG of the annotated DEGs across one comparison between miR472 OE lines (miR472‐OE‐1# and miR472‐OE‐7#) and Col‐0 WT. The y axis indicates the KEGG pathway. The x axis indicates the Rich factor. High q values are shown in red and low q values are shown in green
