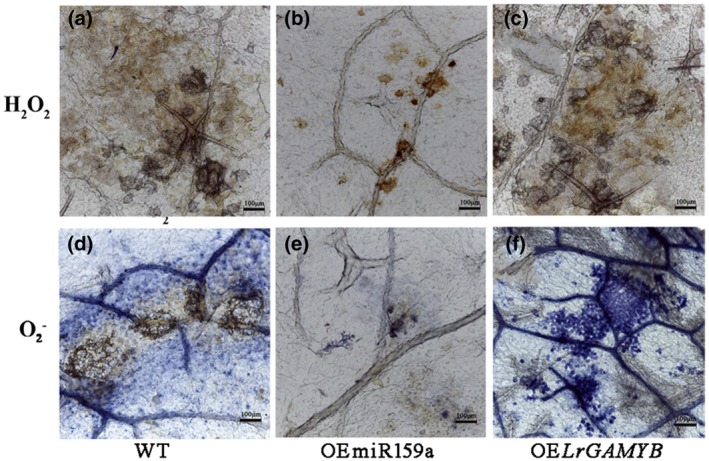
Figure 7.

Temporal evolution of H2O2 and accumulation in the leaves of wild‐type (WT) and transgenic Arabidopsis overexpressing miR359a (OEmiR359a) or LrGAMYB (OELrGAMYB) following Botrytis cinerea inoculation for 48 hr. Scale bar = 100 μm. (a) to (c) are stained with 3,3′‐diaminobenzidine and show the accumulation of H2O2; (d) to (f) are stained with nitroblue tetrazolium and show the accumulation of
