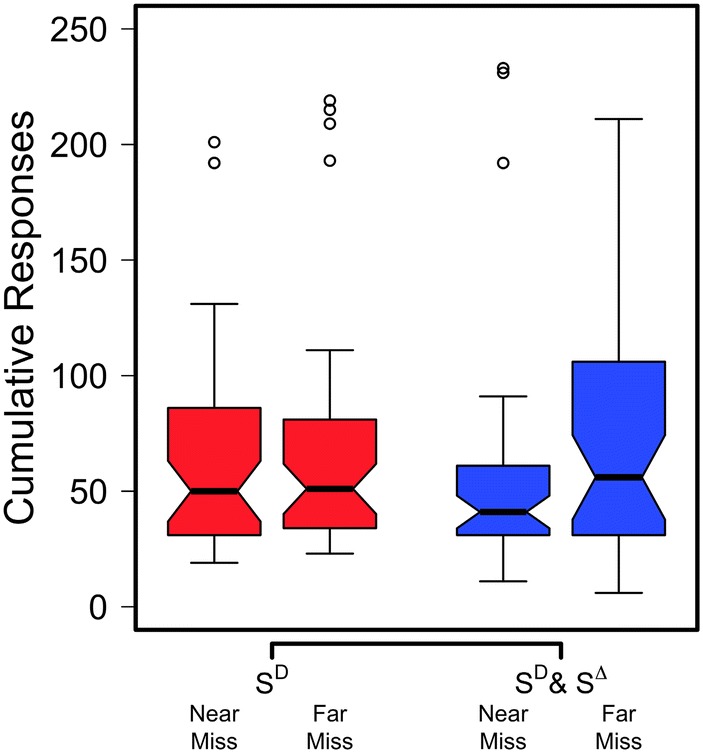
Fig. 3.

The results of Experiment 2. Plot displays notched box-and-whisker plots diagramming cumulative responses during extinction for SD and SD&S∆ groups across the near-miss and far-miss treatments. Whiskers follow the 1.5 × IQR rule. Hollow circles show data points falling outside the whisker edges
