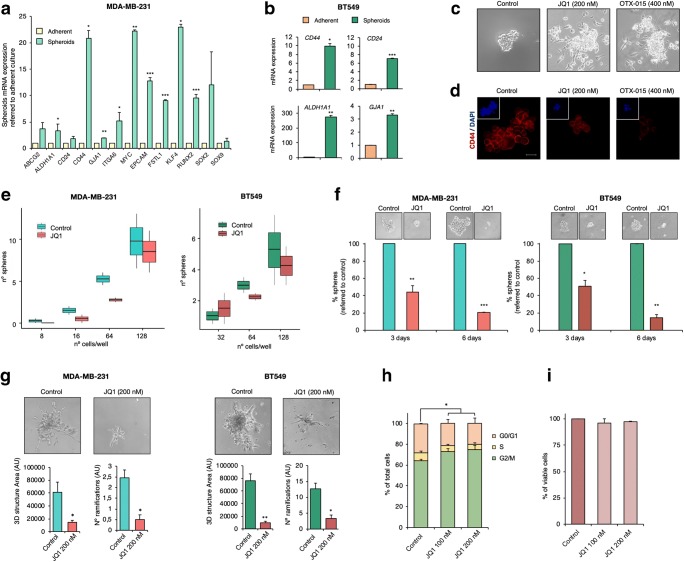
Fig. 2.
BET inhibitor JQ1 impairs crucial stemness-related functions in CSC-mimicking spheroid models. a. Relative mRNA expression levels of several CSC markers in the MDA-MB-231 spheroid model (green) compared to those in adherent cultures (light yellow). b. Relative mRNA expression levels of CD44, CD24, ALDH1A1 and GJA1 in the BT-549 spheroid model (dark green) compared to those in adherent cultures (orange). c. MDA-MB-231 cells were treated with the JQ1 or OTX-015 at the indicated doses for 72 h after which images were taken using an inverted microscope. d. Remaining floating spheres from c were tested for CD44 surface expression (Red). Stained spheroids were observed by confocal microscopy. Squares display TS nuclear counterstaining with DAPI (blue). e. MDA-MB-231 and BT549 spheroids were mechanically dissociated and next exposed to JQ1 (200 nM). Secondary formed spheroids were counted at day 3 and, subsequently, dissociated again to produced tertiary spheroids (day 6). Pictures were taken at both time points using and inverted microscope. f. MDA-MB-231 and BT549 spheroids were mechanically dissociated after which serial dilutions were performed to cover a range from 1 to 200 cells per well (in triplicates). LDA in the absence and presence of JQ1 (200 nM) was performed to evaluate the self-renewal capacity of the spheroid models. The ability to form tumour spheres in both conditions was evaluated at day 21 and formed spheroids were counted. g. Freshly dissociated MDA-MB-231 or BT549 spheroids (10.000 cells/well in 48-well plates) were gently layered on a thin matrigel matrix. 24 h later, matrigel-embedded cells were left untreated or exposed to JQ1 (200 nM). 48 h later, pictures of the invasion structures were taken, and 3D structure areas and the number of ramifications of each condition were evaluated. h. MDA-MB-231 spheroids were incubated with JQ1 at the indicated doses. After 24 h, cell cycle progression was examined by flow cytometry. DNA staining was performed using propidium iodide. The histogram shows the percentage of cells in the different phases of the cell cycle. i. MDA-MB-231 spheroids were exposed to the indicated doses of JQ1. After 72 h, apoptotic activity was assessed by flow cytometry by Annexin V binding evaluation. The histogram shows the percentage of viable cells (Annexin V-). All results shown represent the average of 3 independent experiments. Student t-test: * p < 0,05, ** p < 0,01 and *** p < 0,001

