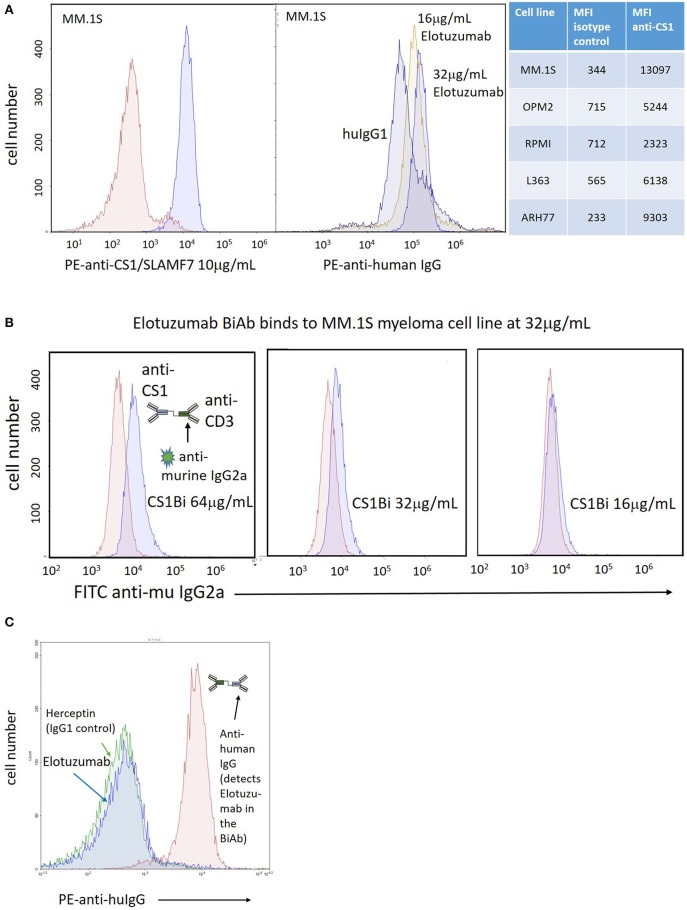
Figure 3.
Expression of CS-1 on MM cell lines. (A) Left panel: Right peak shows binding of PE-anti-CS1 (Abcam, 95827; clone 162) at 10 μg/mL and 0.4 million MM.1S cells after incubation in 100 μL phosphate buffered saline (PBS)/0.2% bovine serum albumin for 20' at 4°C; Left peak shows binding of PE-isotype control. Right panel: Right peaks show relative binding of Elo to MM.1S cells incubated at 16 μg/mL and 32 μg/mL relative to 32 μg/mL human IgG1 (left peak), stained with PE-anti-human IgG (Biolegend, 409304; clone HP6017). The relative binding of the Abcam PE-anti-CS1 vs. isotype control for 5 MM cell lines is shown in the table to the right of the histogram panels. (B) Arming titration of CS1-BATs against MM.1S MM cells. Each panel shows binding of CS1Bi by FITC anti-murine IgG2a at either 16, 32, or 64 μg/mL CS1Bi/0.4 million ATC after incubation in 100 μL phosphate buffered saline (PBS)/0.2% bovine serum albumin for 20' at 4°C. The histograms are overlaid against staining of MM.1S by 8, 16, or 32 μg/mL OKT3, respectively, which represents the relative amount of OKT3 in the CS1Bi product. (C) Binding of CS1Bi to ATC. CS1Bi was incubated at 500 ng/mL/0.4 million ATC in 100 μL for 20' at 4°C followed by staining with PE-anti-human IgG. Right peak shows the binding to Elo in the bound BiAb. The left peaks show background binding of ATC incubated with Elo or Herceptin (both human IgG1 isotype) at 2 μg/mL/0.4 million ATC.

