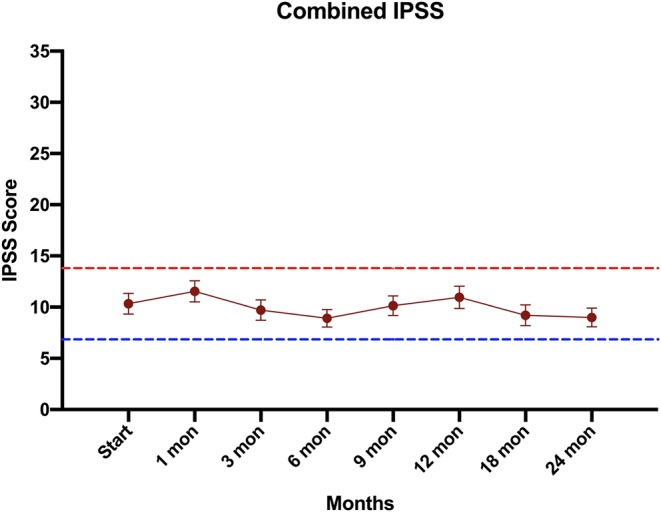
Figure 3.

Urinary quality of life using the International Prostate Symptom Scoring (IPSS) score. The graphs show unadjusted changes in average scores over time for each domain. IPSS scores range from 0 – 35 with higher values representing worsening urinary symptoms. Error bars indicate SEM. The dashed lines represent the minimally important difference values.
