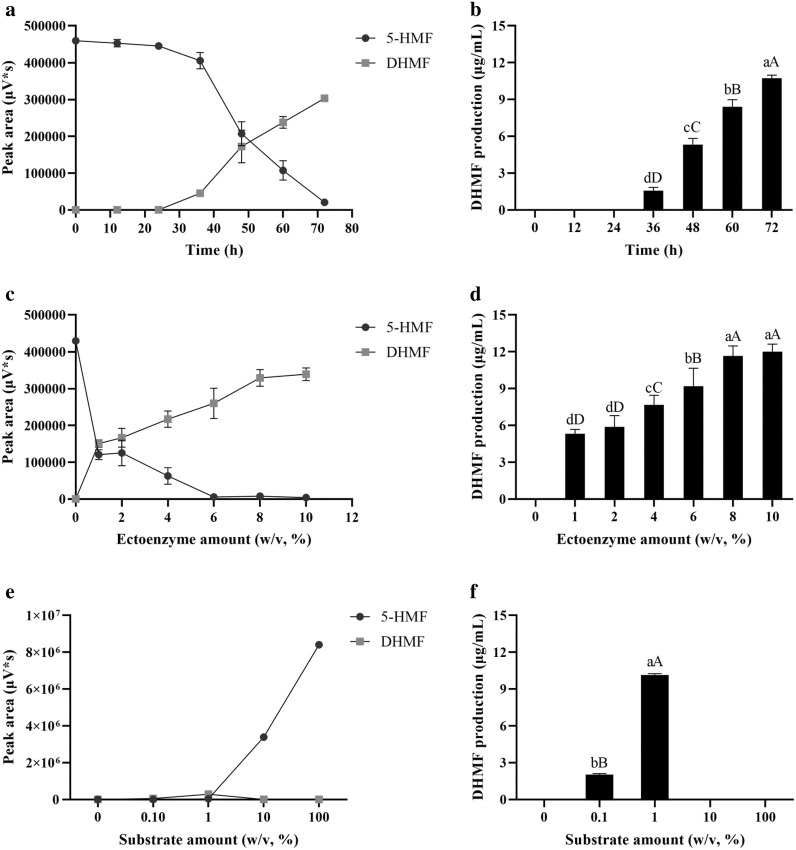
Fig. 4.
The effect of time (a, b), ectoenzyme amount (c, d) and substrate amount (e, f) on biotransformation of 5-HMF. Data were represented as mean ± SD and the experiment was repeated three times. Columns labelled with different lower case letters were significantly different at P < 0.05, and upper case letters were significantly different at P < 0.01 (S–N–K). For example, there was a significant difference in the biotransformation rates between 72 and 60 h (P < 0.01)

