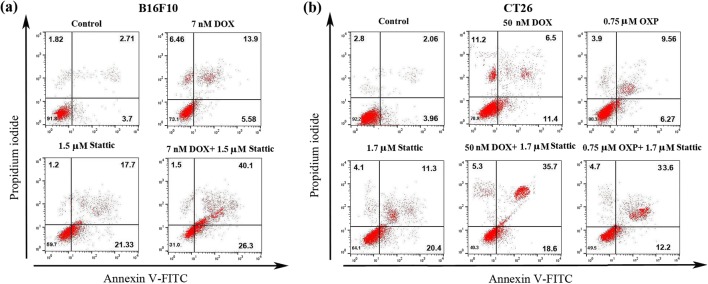
Fig. 2.
Representative dot plot graph showing frequency of early and late apoptotic death after 48 h treatment of (a) B16F10 cells with DOX, stattic and DOX + stattic and (b) CT26 cells with DOX, OXP, stattic, DOX + stattic and OXP + stattic, as assessed by Annexin/PI staining and analyzed by flow cytometry. Each experiment was conducted in triplicate. DOX, doxorubicin; and OXP, oxaliplatin

