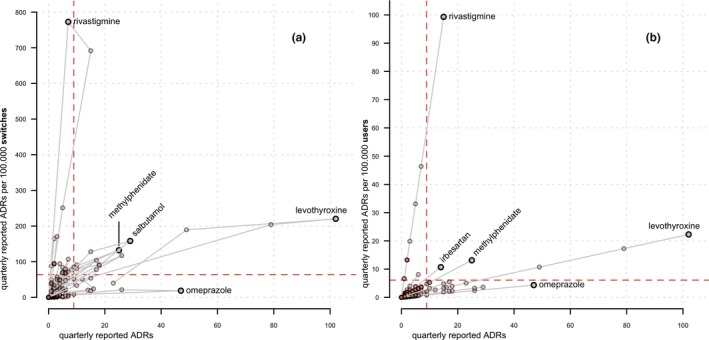
Figure 5.

(a) Comparison between switch‐corrected, and user‐corrected quarterly reported adverse drug reactions (ADRs), with a plot (a) of the absolute number of quarterly reported ADRs per active substance on the x‐axis and number of switch‐corrected quarterly reported ADRs per 100,000 switches on the y‐axis; and a plot of (b) of absolute number of quarterly reported ADRs per active substance on the x‐axis and number of user‐corrected quarterly reported ADRs per 100,000 users on the y‐axis; gray lines connect values for quarters of a single active substance in chronological order, and dashed lines are the threshold values, defined as the mean number of the absolute, switch‐corrected, or user‐corrected reported ADRs + 1 SD. The total number of quarterly data points per active substance is 30.
