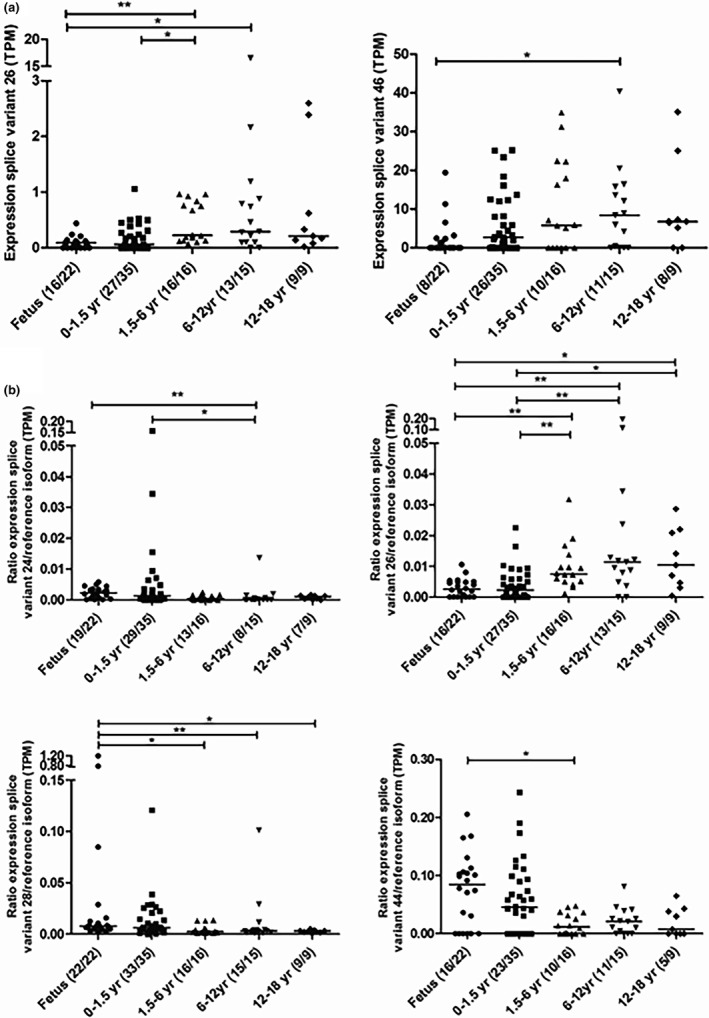
Figure 3.

Expression (a) and expression in relation to the reference isoform (b) of developmentally regulated splice variants of SLCO1B1 in various age groups. Counts of tissues with isoform expressed out of total counts by age group are provided in parentheses. *P < 0.05; **P < 0.01. TPM, transcripts per million.
