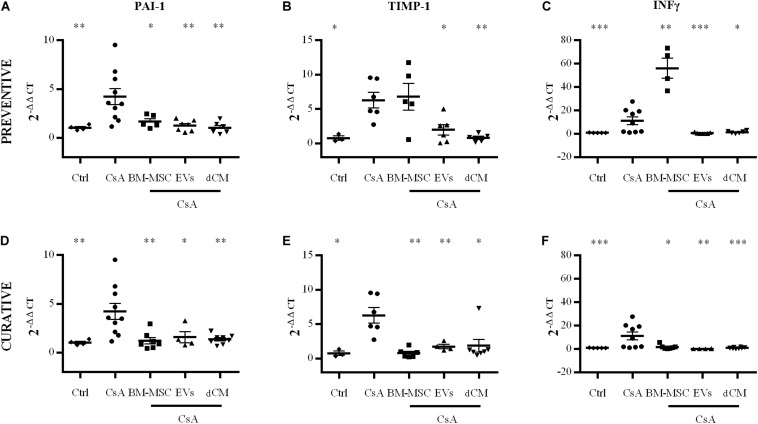
FIGURE 10.
Impact of cell therapies on the expression of renal fibrosis markers, PAI-1, TIMP-1, and IFN-γ in CsA-induced nephrotoxicity. The quantification of gene expression was evaluated by real-time PCR using the 2−ΔΔCt method and normalizing with HPRT as the endogenous control. (A) Preventive treatment. (B) Curative treatment. (n = 6 per group). * Significantly different compared to CsA group (*P < 0.05; **P < 0.01; ***P < 0.001). Data are expressed as mean ± SEM. Unpaired Student’s t-test was used for statistical analysis.

