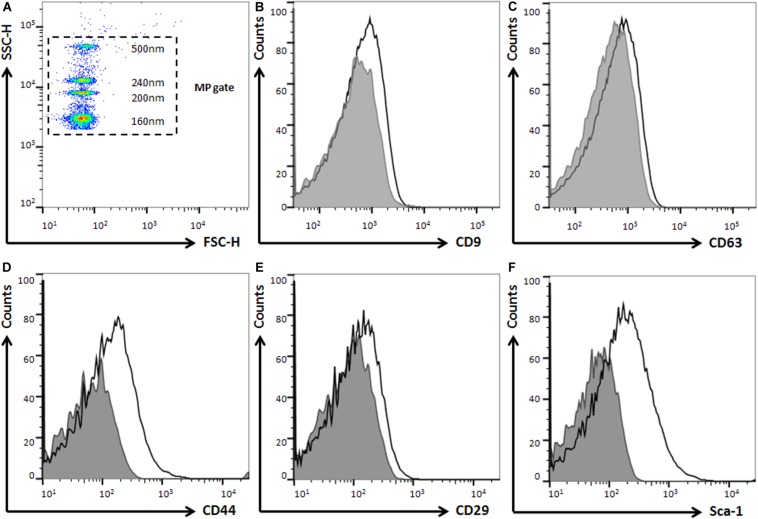
FIGURE 4.
Characterization of EVs by flow cytometry. (A) Representative microparticle analysis showing Megamix-Plus SSC as internal size standards (160, 200, 240 and 500 nm). (B,C) Positive expression of tetraspanins as EVs markers: CD63 and CD9. (D–F) Positive expression of mesenchymal markers: CD44, CD29, and Sca-1. Shaded gray represents isotype as negative controls.

