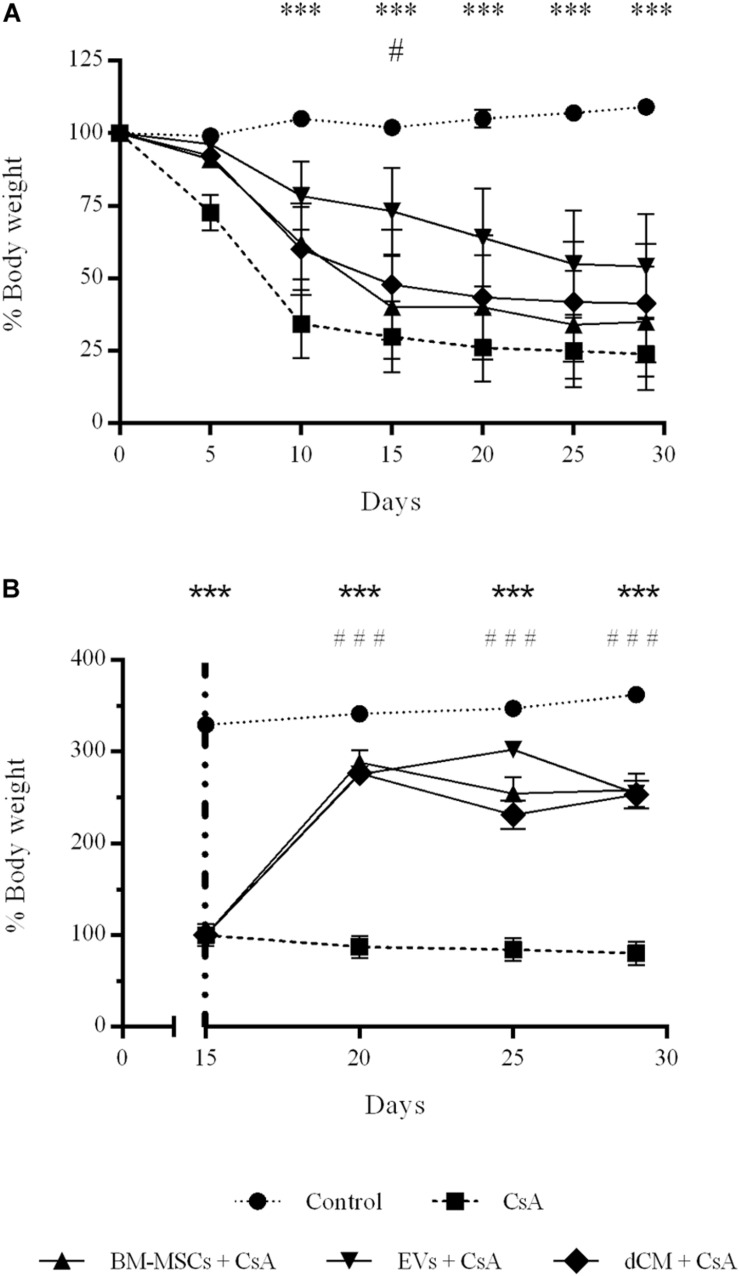
FIGURE 5.
Impact of CsA-induced nephrotoxicity on mice body weight recorded weekly during the model. (A) Preventive treatment. (B) Curative treatment. (CsA, n = 70), (BM-MSCs, n = 35), (EVs, n = 34), and (dCM, n = 16) *Significantly different when compared CsA versus control group (∗∗∗P < 0.001). #Significantly different when compared CsA versus treatment groups (#P < 0.05). Data are expressed as mean ± SEM. One-way analysis of variance (ANOVA) followed by Dunnett’s multiple comparisons test was used to compare group’s means.

