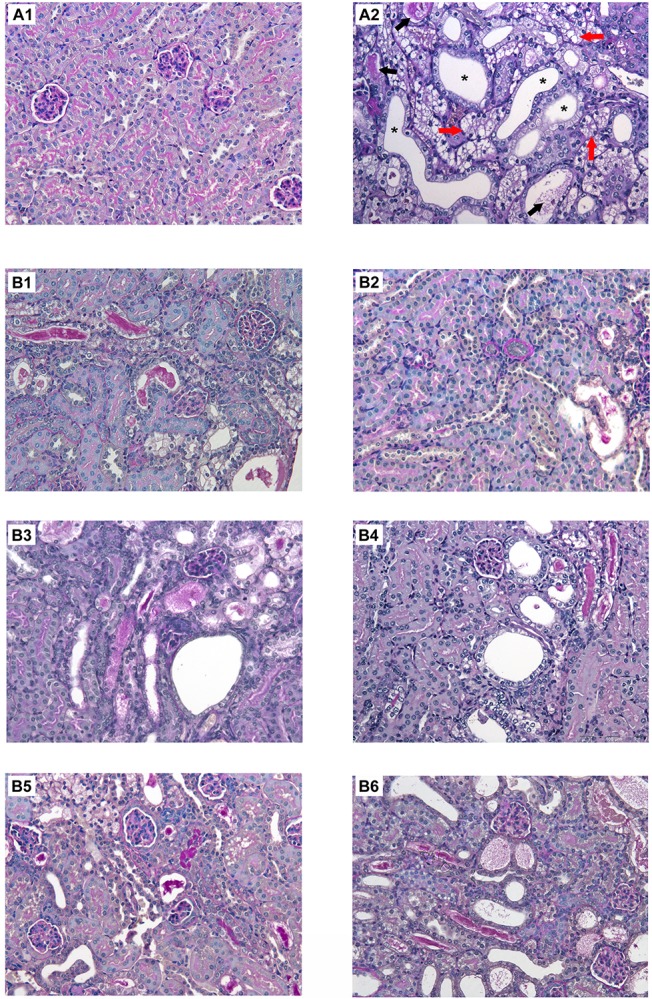
FIGURE 7.

Histological changes in renal sections stained with PAS from mice with CsA-induced nephrotoxicity with or without different regimens of cell therapy (BM-MSC, EVs and dCM). (A) Representative micrographs of kidney histology of healthy C57BL/6 mice treated with castor oil as control group (A1) and mice treated with CsA (75mg/kg daily) indicating tubular vacuolization (red arrow), hyaline casts (black arrow) and cysts (asterisks) (A2). (B) Preventive treatments of CsA nephrotoxicity with BM-MSC (B1), EVs (B3), and dCM (B5); curative treatments of CsA nephrotoxicity with BM-MSC (B2), EVs (B4), and dCM (B6). PAS staining. Original Magnification: x200.
