FIGURE 4.
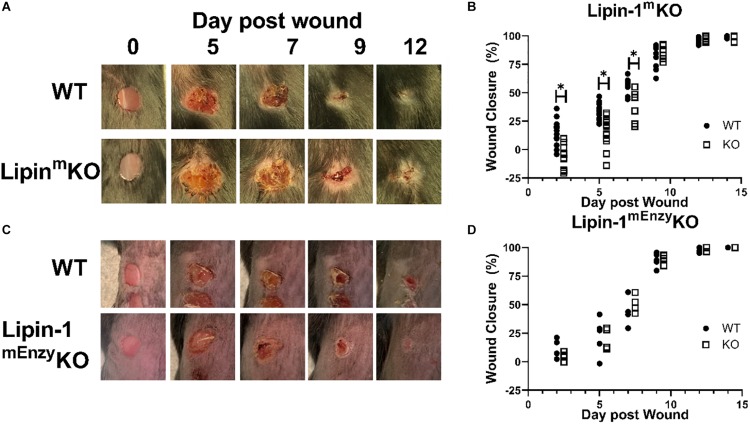
Loss of full lipin-1 delays wound closure. (A,C) Representative image of gross lesions. (B,D) Percent wound closure as [(area of original wound - area of current wound)/area of original wound] × 100. Wound measurements were made on days 0, 2, 5, 7, 9, 12, and 14 post-wounding. KO mice are shifted by a half day in graph in order to see differences (Experiment was performed a minimum of three times and each dot represents a single animal) *p < 0.05. Each symbol represents an individual mouse.

