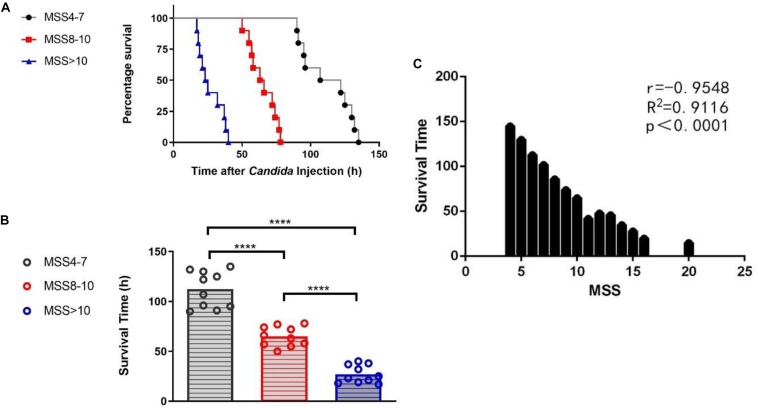
FIGURE 2.
Group difference and correlation between Murine Sepsis Score (MSS) and survival time of mice. Survival rates between MSS 4-7, MSS 8-10 and MSS >10 mice (A). Mice in different MSS group had varied survival time (B). Correlation between MSS and survival time (C). Survival rates were observed for every 1 h after Candida injection. P-value between any two of the three different curves of MSS groups analyzed by log-rank test was <0.0001. MSS was assessed at 12 h after Candida injection. Mean ± SD, 10 mice per group. ****P < 0.0001.

