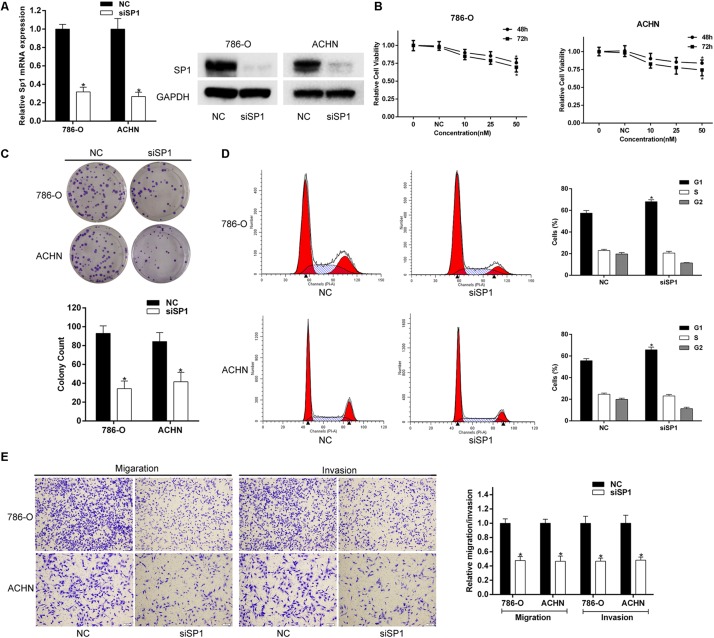
FIGURE 5.
Knockdown of SP1 expression phencopied the effect of miR-362-3p in RCC cells. (A) Western blot and qRT-PCR analysis showed reduction of SP1 protein and mRNA expression after siSP1 treatment. (B) The effect of siSP1 on the viability of RCC cells with CCK-8 assay. (C) The effect of siSP1 on the viability of RCC cells with Colony formation assay (Representative wells were presented). (D) The effect of siSP1 on the cell cycle progression with Flow cytometric analysis. (E) The effect of siSP1 on migration and invasion with Transwell assay (representative micrographs were presented), *P < 0.05.

