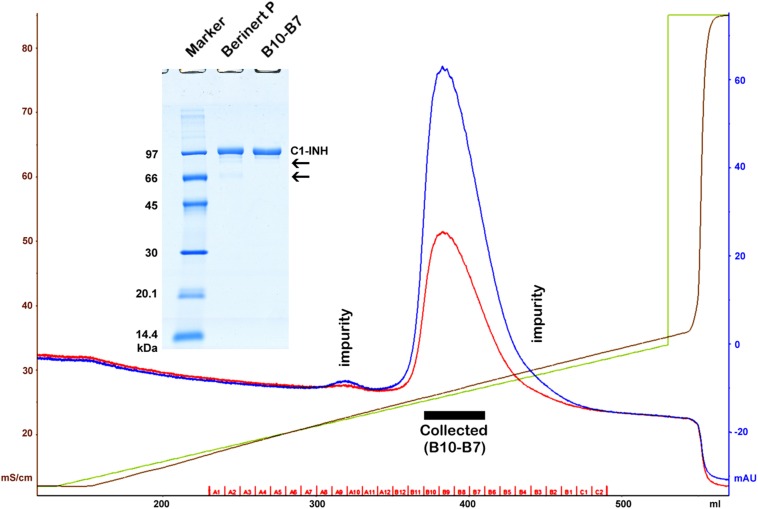
FIGURE 1.
Purification of Berinert P (C1-inhibitor) by anion exchange chromatography. A black rectangle indicates the collected pure fractions representing the middle of the main peak. Blue, red, green and brown lines depict the absorbance at 280 nm, the absorbance at 254 nm, the gradient, and the specific conductivity, respectively. Removed impurities are indicated by labels on the chromatogram, and by arrows on the gel (insertion). SDS-PAGE was performed under reducing conditions. The marker (GE Healthcare Low Molecular Weight marker) is composed of 97, 66, 45, 30, 20.1, and 14.4 kDa proteins.

