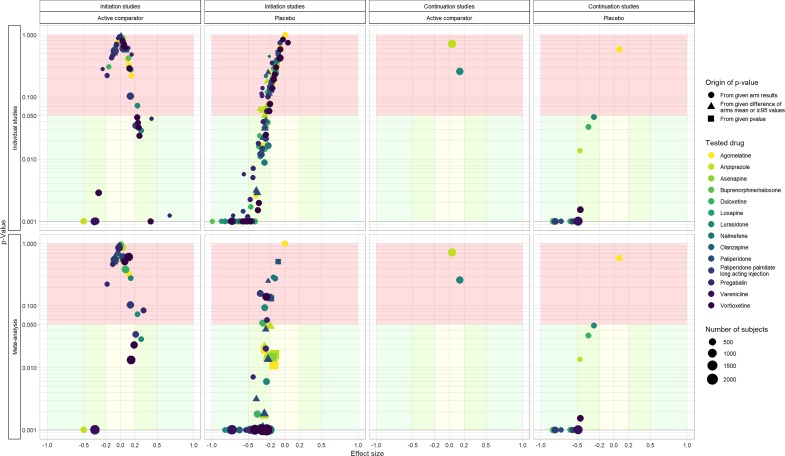
Fig. 3.
Effect sizes and p values observed in individual studies and meta-analyses pooled by drug and daily dose, for each study design. For each plot, the x-axis presents effect sizes and the y-axis (log scale) presents p values. Top plots present data at the study level and bottom plots present data at the meta-analysis level (data were pooled by drug and daily dose).

