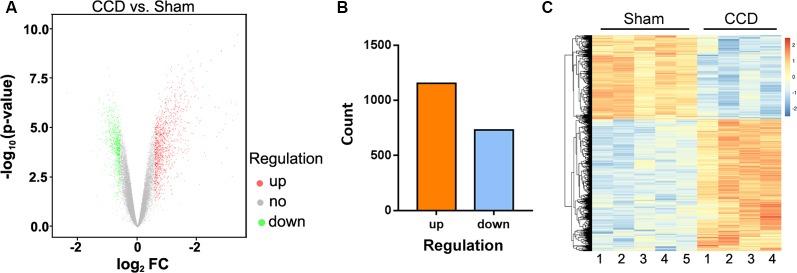
Figure 2.
DEGs between the CCD group and the sham group. (A) Volcano plot of the −log10(p-value) against the log2FC of each gene. Red dot indicates an upregulated DEG, whereas green dot indicates a downregulated gene. Gray indicates that there is no statistically significant difference in gene expression. (B) There were 1,887 DEGs identified between the CCD group and the sham group. Of these genes, 1,156 were upregulated and 731 were downregulated. (C) Hierarchical clustering shows the DEGs between the two groups. The number at the bottom represents the name of the samples. The color scale at the top right represents the normalized expression data, which represents the degree of gene clustering. The upregulated genes are indicated in red, and the downregulated genes are indicated in blue. DEGs, differentially expressed genes; CCD, chronic compression of the dorsal root ganglion surgery group; FC, fold change; sham, compression of the dorsal root ganglion sham group. The p-value was corrected by false discovery rate (FDR).

