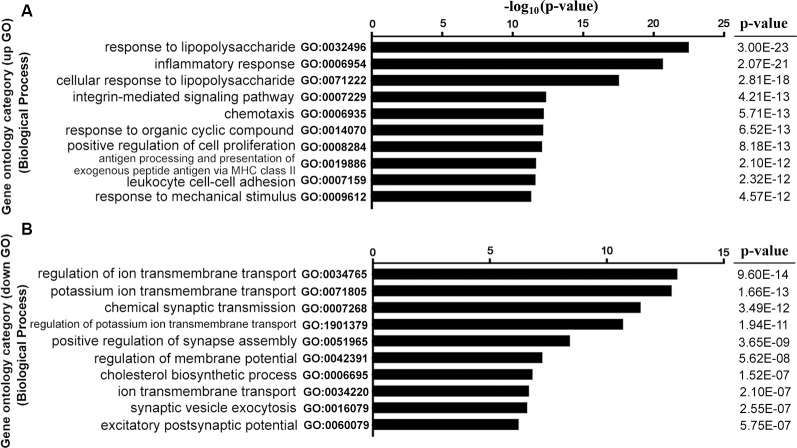
Figure 3.
Functional enrichment analysis for DEGs. GO terms enriched by upregulated (upGOs) and downregulated genes (downGOs) are shown as (A) and (B), respectively. The horizontal axis represents the value of −log10 (p-value), and the vertical axis represents the category of GO biological processes. P-value was adjusted by FDR. GO, gene ontology. BP, biological process.

