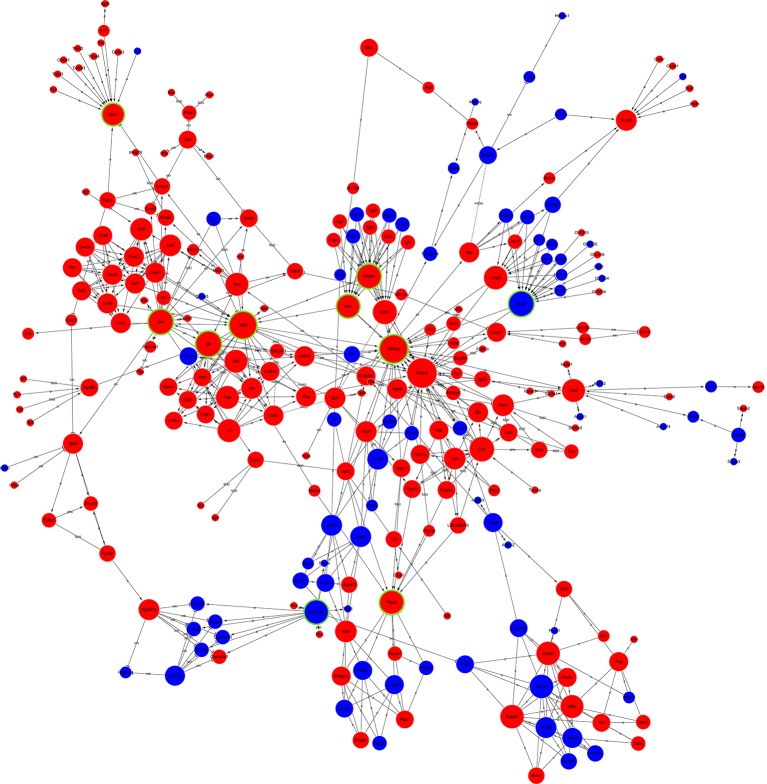
Figure 5.
Global signal transduction network of DEGs. The red node represents an upregulated gene, and the blue node represents the downregulated gene. The lines exhibit the interaction between the genes. The size of the node indicates the degree of interacting with other genes. The more important the genes are, the larger the node is. Nodes with green rings were the genes that were selected to be experimentally validated.

