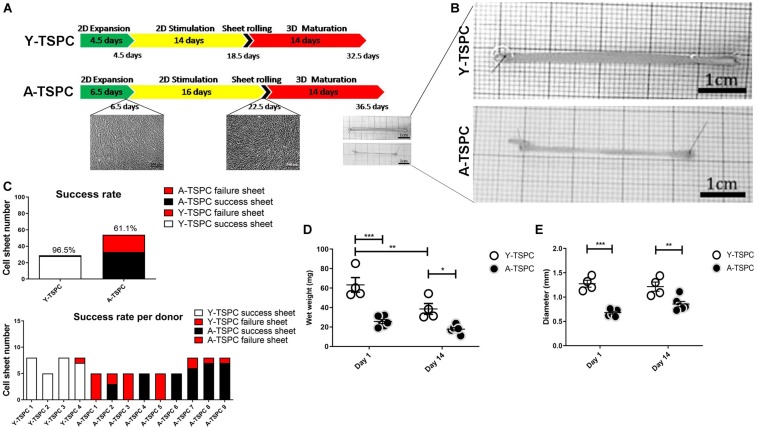
FIGURE 1.
Cell sheet procedure and gross morphological data. (A) Cartoon depicting the 3-step protocol for cell sheet formation. (B) Representative macroscopy images Y-TSPC and A-TSPC sheets at day 14. (C) Success rate of all donors (upper panel) success rate of each individual donor (lower panel). (D) Comparison of TSPC sheet wet weight at day 1 and 14. (E) Comparison of TSPC sheet diameter at day 1 and 14. Y-TSPC n = 4; A-TSPC n = 9; *p < 0.05, **p < 0.01, and ***p < 0.001.

