
FIGURE 7.
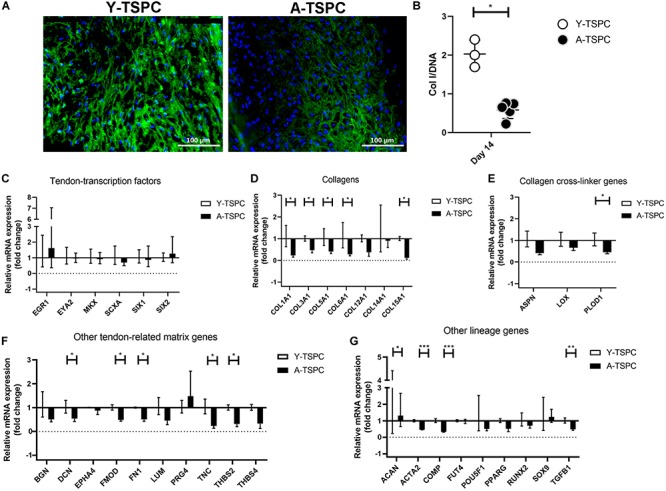
Collagen I protein production and gene expression profiling by Real Time PCR. (A) Representative collagen I immunofluorescent images of Y-TSPC and A-TSPC sheets at day 14. (B) Quantitative analysis of collagen I by ELISA. For (A,B) Y-TSPC n = 3; A-TSPC n = 6. Normalization to DNA. Quantitative PCR analysis for tendon-transcription factors (C), collagen genes (D), cross-linker genes (E), tendon-related ECM genes (F) other lineage genes (G). Gene expression was calculated as fold change to Y-TSPC group. GAPDH was used as reference gene in each group. Non-detectable (Ct over 38 genes were not included in the graphs. For (C–G) Y-TSPC n = 3; A-TSPC n = 3; ∗p < 0.05, ∗∗p < 0.01, and ∗∗∗p < 0.001.