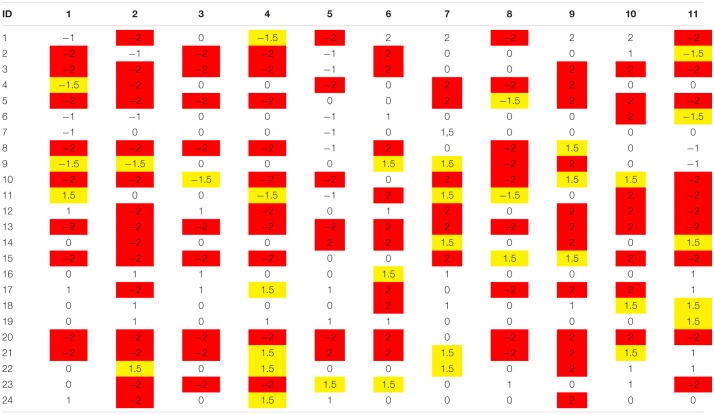
TABLE A1.
Table detailing the performance of each child with ASD on each linguistic measure
Table showing the z-scores of each participant with ASD on each linguistic measure. Z-scores highlighted in yellow show performances of about 1.5 SDs above (in case of errors) or below expected means. Z-scores highlighted in red show performances of about at least 2 SDs above (in case of errors) or below expected means. Legend: 1. Naming; 2. Sentence Completion; 3. Lexical Comprehension; 4. Grammatical Comprehension; 5. Speech Rate; 6. % Semantic Errors; 7. % Paragrammatic Errors; 8. % Complete Sentences; 9. % Local Coherence Errors; 10. % Global Coherence Errors; 11. % Lexical Informativeness.

