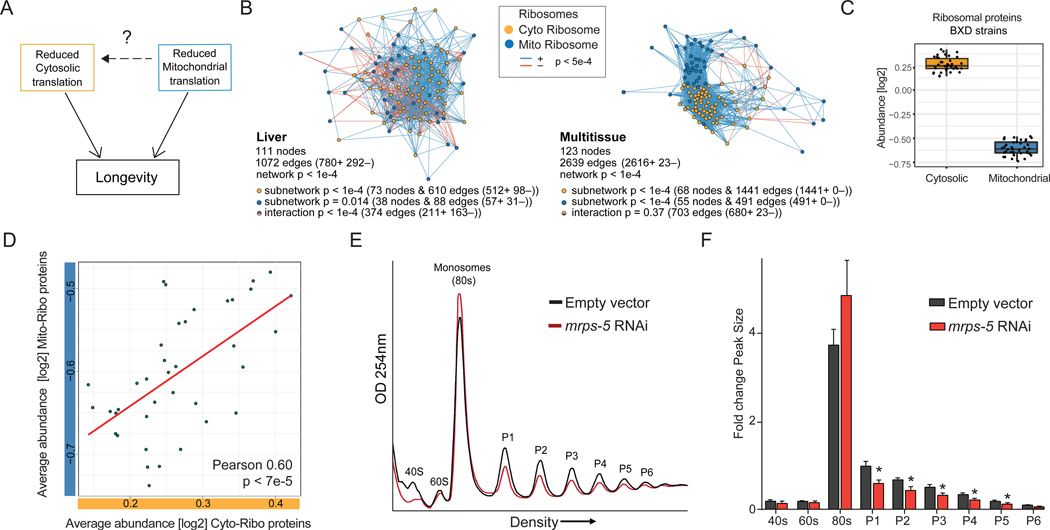
Figure 1. A conserved mito-cytosolic translational balance in mice and worms.
(A) Model showing possible links between two branches of translation regulation in lifespan control; cytosolic (yellow) and mitochondrial (blue).
(B) Correlation networks in BXD mice show strong relationships between mitochondrial and cytosolic ribosomal protein levels both in liver (left) and across multiple tissues (right), suggesting that the subunits within ribosomes and across ribosomes are coregulated. Both networks show enriched connectivity. Liver: 73 nodes for the cytoribosome subnetwork have 610 edges (p < 1e-4, 512 are positively correlated), 38 nodes for the mitoribosome subnetwork have 88 edges (p = 0.014, 57 are positively correlated), 374 nodes are involved in the interaction between mitoribosome and cytoribosome subnetworks (p < 1e-4, 211 are positively correlated). Multitissue: 68 nodes for the cytoribosome subnetwork have 1441 edges (p < 1e-4, 1441 are positively correlated), 55 nodes for the mitoribosome subnetwork have 491 edges (p <1e-4, 491 are positively correlated), 703 nodes are involved in the interaction between mitoribosome and cytoribosome subnetworks (p < 1e-4, 680 are positively correlated). For significance testing, 10,000 random networks were permuted using the same input data and gene set size for each data set and subset with gene sets of the same size selected at random out of the full proteomic datasets. A reported p < 1e-4 means that none of the 10,000 random networks were as significant as the selected ribosome gene sets taken from literature.
(C) BXD mouse strains showing natural variation in cytosolic (yellow) or mitochondrial (blue) ribosome abundances in liver proteome. Each dot represents one BXD strain’s average abundance of either the cytosolic or mitochondrial ribosomes.
(D) Averaged abundances from mitochondrial and cytosolic ribosomes in the BXD liver proteome (from (C)) show correlation between mitochondrial and cytosolic abundances (Pearson 0.60, p < 7e-5).
(E) Representative polysome profiles showing decreased cytosolic polysome abundances in worms with impaired mitochondrial ribosomal biogenesis (mrps-5 RNAi). Lysate is normalized to protein levels. The subunits (40S and 60S), monosomal peak (80S), and polysomal peak numbers are indicated (P1–P6).
(F) Quantification of polysome peak sizes of representative experiment with N=4 per condition normalized to P1 peak of empty vector control worms. Error bars represent mean ± SD and significance was tested with Student’s t-test, and p-values were adjusted to correct for multiple testing using the Holm-Šídák method, with α = 0.05.

