Figure 12.

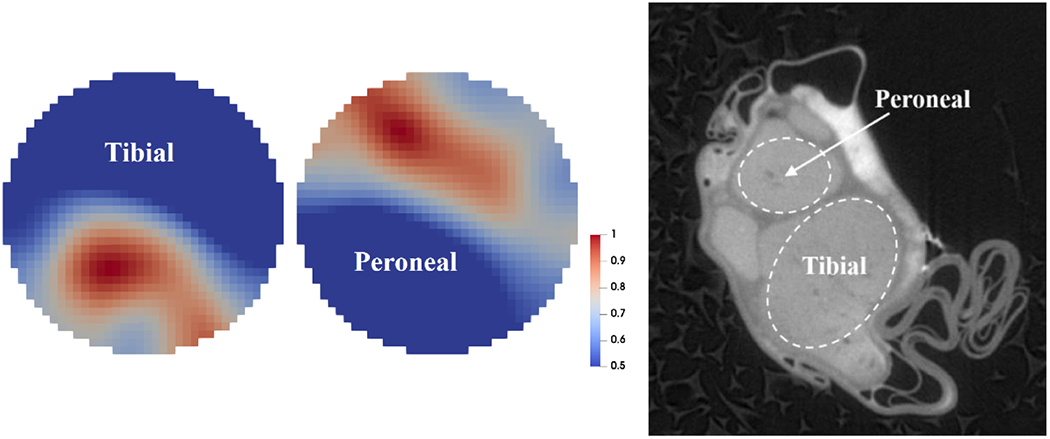
Left: example of EIT imaging of compound activity from tibial and peroneal fascicles (normalized FWHM visualization). Right: MicroCT scan of the same nerve (raw scan, before co-registration).

Left: example of EIT imaging of compound activity from tibial and peroneal fascicles (normalized FWHM visualization). Right: MicroCT scan of the same nerve (raw scan, before co-registration).