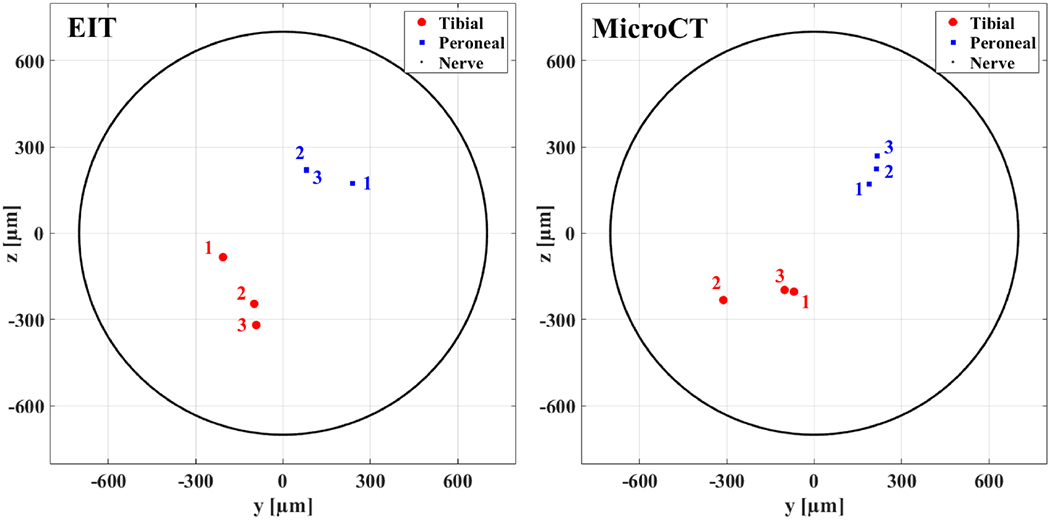
Figure 13.

Centres of mass estimated from EIT reconstructions (left) and computed from reference microCT scans (right) for N=3 nerves. CoMs are shown in red dots for tibial fascicles and blue squares for peroneal fascicles. Data from each of the three nerves is marked with labels 1-3. Peroneal EIT-computed CoMs 2 and 3 present strong overlapping and are not distinguishable. External nerve boundary is shown as a black line. In the left panel, only two out of three EIT CoMs are visible for peroneal fascicle as two of them strongly overlap.
