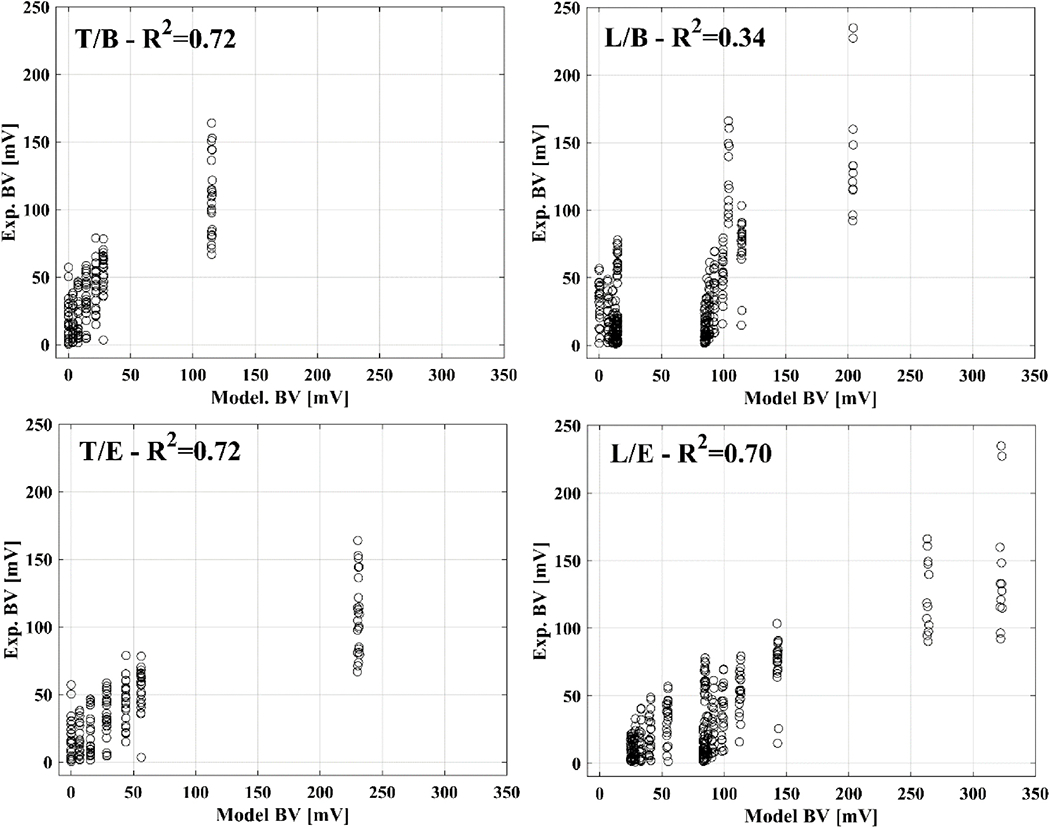
Figure 7.

Example of correlation between boundary voltages from the forward model and experimental data. Correlation is shown for transversal (T) or longitudinal (L) injections and for basic (B) or extended (E) forward models.

Example of correlation between boundary voltages from the forward model and experimental data. Correlation is shown for transversal (T) or longitudinal (L) injections and for basic (B) or extended (E) forward models.