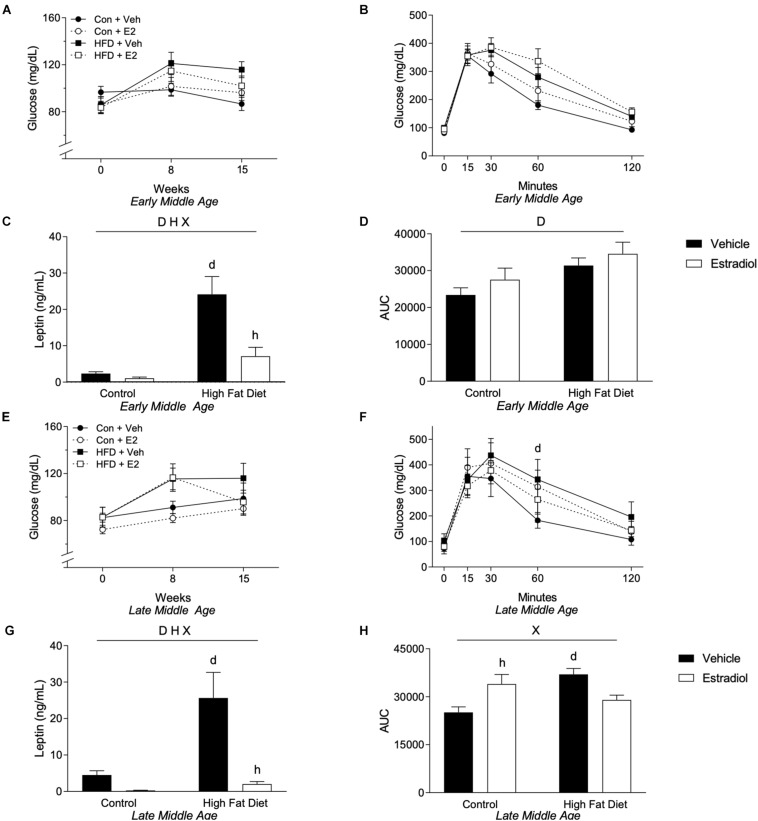
FIGURE 3.
Metabolic effects in early- and late-MA female 3xTg-AD mice. Fasting glucose was measured at weeks 0, 8, and 15. Fasting glucose levels for (A) early-MA and (E) late-MA mice. An oral glucose tolerance test was administered at week 15 in (B) early-MA and (F) late-MA females. Fasting leptin was measured from the plasma collected at week 16 in (C) early-MA and (G) late-MA mice. The area under the curve (AUC) was calculated from the glucose tolerance test in (D) early-MA and (H) late-MA mice. Significance is p < 0.05. D = significant main effect of diet; H = significant main effect of hormone treatment; X = significant interaction between diet and hormone; d = significant post hoc effect between diets, but within hormone treatment; h = significant post hoc effect between hormone treatment, within diet.

