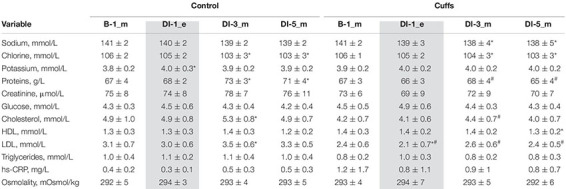
TABLE 2.
Blood assessment (chemistry, cardiovascular hormones, metabolic parameters).
 |
Values are mean ± SD; *p ≤ 0.05 vs. baseline; #p < 0.05 vs. Control; m, morning; e, evening; shadowed, 8 h after the onset of immersion.
Blood assessment (chemistry, cardiovascular hormones, metabolic parameters).
 |
Values are mean ± SD; *p ≤ 0.05 vs. baseline; #p < 0.05 vs. Control; m, morning; e, evening; shadowed, 8 h after the onset of immersion.