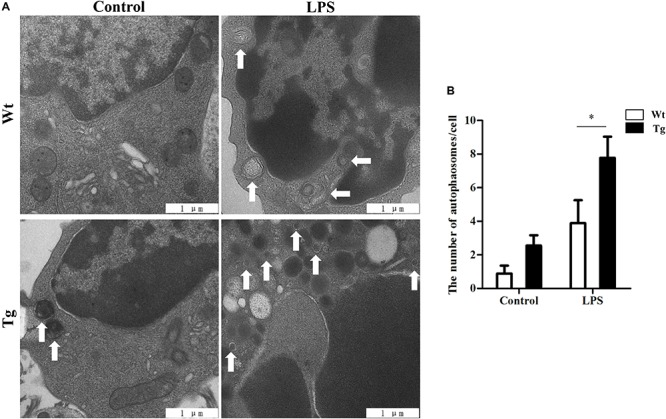
FIGURE 2.

Autophagosomes/autolysosomes increase in Tg sheep. (A) Transmission electron microscopy images: the white arrows indicate autophagosomes/autolysosomes; ×20,000; scale bar: 1 μm. (B) Statistical analysis of the number of autophagosomes/autolysosomes per cell. Statistical analysis of not fewer than 25 cells. Wt, wild-type sheep; Tg, transgenic sheep. All data are presented as the mean ± SEM from three experiments. ∗P < 0.05 vs. Wt group.
