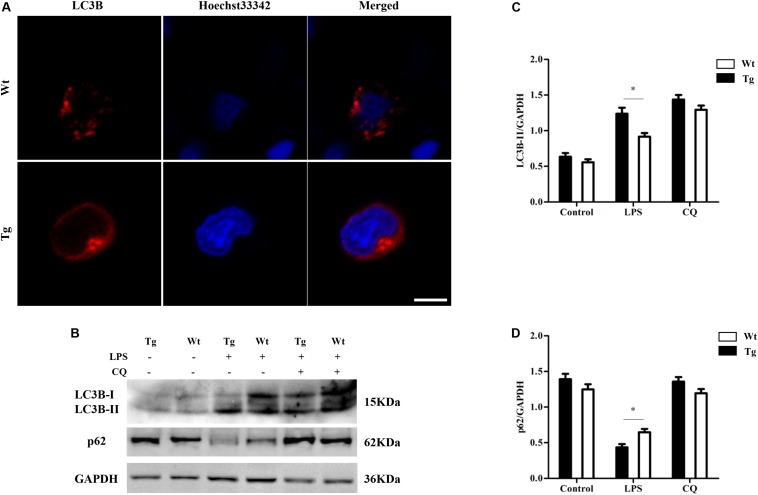
FIGURE 3.
LC3B increases in Tg sheep. (A) Immunofluorescence images of LC3B under laser scanning confocal microscope. Red: Cy3-labeled LC3B protein; blue, Hoechst33342-labeled nuclei; scale bar: 5 μm. (B–D) Analysis of LC3B and p62 level by Western blot. Wt, wild-type sheep; Tg, transgenic sheep. ∗P < 0.05 vs. Wt group.

