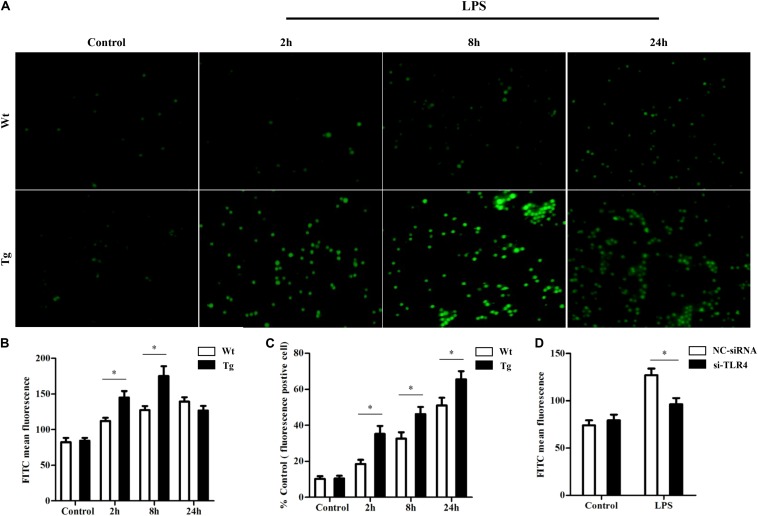
FIGURE 5.
TLR4 effects on reactive oxygen species (ROS) production by TLR4 overexpression or RNAi. (A,B) Analysis of ROS by DCFH-DA in monocytes. ROS was detected by dichlorodihydrofluorescein diacetate, and a fluorescence microscope was used to count the positive cells, ×200. (C) ROS fluorescent positive cells; statistical analysis of not fewer than 100 cells. ∗P < 0.05 vs. Wt group. (D) TLR4 RNAi effects on ROS production. ∗P < 0.05 vs. NC-siRNA group.

